
In this lesson, I'm going to teach you all about financial statement analysis. It's a hugely important topic and I want to make sure that you understand not just how to do the calculations that are involved, but how to use them, how to interpret them, how to generate meaning with the results. So, let's get started!
We're going to look first at the discursive context in which you find the financial statements of a company, which is the annual report. Then I'll discuss some basic principles of financial statement interpretation. We’ll then get into the techniques, starting with a high level view of the various statements, and then zoom in using ratio analysis to dig into the details of the statements. Finally, I'll talk about how to pull all of these pieces together into a full interpretation of a company's financial statements.
There are two documents for you to download to help you work through this lesson. One is the 2015 annual report for a multinational dairy company called Saputo. I use the 2015 statements so that you can then find the most recent annual report for the company online and try repeating the calculations with that data, to compare how the company is doing now. The second document is a spreadsheet containing all the numbers from the main Saputo financial statements for 2015. I keyed them in myself, and I encourage you to adopt this practice because it helps you get a feel for the numbers. Use the spreadsheet to practice the calculations that we discuss here.
Annual Reports
Annual reports are, to put it rather bluntly, propaganda. They are designed to persuade. And if you are uncertain of whether that's true, you might want to consider this picture. It adorns the cover of the annual report of Canadian Oil Sands, one of the worst polluters in the world.

All of the tar sands companies are terrible polluters of the environment. To put a picture of a beautiful little bird there — albeit one that is firmly entrapped by the human holding onto its legs — creates an image of the company that is quite at odds with the reality of its performance. As my father used to say, using an Air Force expression, “an ounce of image is worth a pound of performance.”
Annual reports are all about impression management, polishing the image of the corporation. Sometimes its a little bit over the top.
Production
The production of annual reports is very professionalized. Everything is very carefully worded. A lot of wordsmithing goes into phrasing things exactly right, trying to avoid any possible misinterpretation that could lead to negative consequences for the company, such as a drop in stock price or unfavorable publicity.
On top of this, you've got the fact that the production of annual reports is heavily standardized. Every company watches what it's competitors are doing with their annual reports and tries to make sure that they fall in line with industry practices. You don't want to stand out too much with your annual report. You want to make sure it attracts positive attention, but you don't want to do anything too risky and attract negative attention. Companies tend to repeat what they did the year before and modify the structure of the report as little as possible to create the impression of consistency. So there's a lot of copy-and-paste of text, with maybe a refresh of the style of the report to keep it contemporary.
Companies rely on PR firms to do a lot of the production of the annual report. PR experts share training and a body of knowledge about what constitutes best practice for annual reports, as they move from PR firm to PR firm. That leads to a lot of standardization and little innovation.
Control of the Message
An annual report — and I’m not talking about official regulatory filings, I’m talking about the glossy printed reports and the lovely websites that are created around the mandatory filings — begins with pages and pages of self-advertisement. It looks and reads like a commercial for the company.
Besides the nice cover photos, the colorful graphics, and the pictures of happy workers, you have a message from the CEO and sometimes one from the chair of the Board of Directors. These set the tone for the report and are part of the company telling you what to think about the financial statements before you even read them. This is followed by what is called the MD&A, the management discussion and analysis. It is a detailed explanation to the reader of what numbers are important to look at and what those numbers mean. Don’t read it. At least, don’t read it first.
I always caution my students to read the CEO messages and the MD&A after they have dug into the financial statements. You want to go to the financial statements first and develop some critical questions of your own about what's going on at the company. Only then should you look at the MD&A, and at what others on the internet have to say about the company, such as financial analysts. By forming your own questions first, as I will show you in this lesson, you will begin to take control of the production of knowledge about this company, for your own independent purposes. If you start with the MD&A, you are giving up your independence before you even get started. You’ll be adopting the line of thinking that the company’s management wants you to have. You’ll be a consumer of knowledge, not a producer.
MD&A
The MD&A in annual report discusses the performance of the company in comparison with the rest of the industry. It breaks down the performance of the company by the different operating units, or products, or regions, especially if it's a diverse corporation with lots of subsidiaries in different markets.
The MD&A will provide additional financial information that you can’t get in the financial statements, and by “can’t get” I mean financial measurements that violate basic accounting principles. Accounting regulations emphasize conservative measurements that include all costs. They restrict what the company can say in its financial statements. The MD&A presents lots of measurements that do not conform to accounting regulations, carefully curated and shaped by the company to highlight things that the management wants you to pay attention to and distract you from the things they would prefer you ignore. These numbers are not audited in the same way that the financial statements are audited. The only thing the auditors do is look to ensure that there are no statements in the MD&A that contradict what the financial statements say. Management cannot say that sales are up if the financial statements say they are down. Management is free to say, however, that it would have been a great year if it weren’t for pesky accounting technicalities like depreciation or interest or income tax.
One of the things that the MD&A will also do is highlight the estimates and uncertainties behind financial statements numbers, and the risks faced by the company. That can be quite useful in helping you understand what's happening in and around the company, if you can’t find that out anywhere else. (These days, there is no excuse for that. Look for independent news about industry conditions and trends.) Keep in mind, when you read management’s discussion of risks and uncertainties, that there will be a lot of canned phrases that are used by every company, just to protect the company from lawsuits. Sorting out unique business risks from routine disclaimers can be a challenge.
Board of Directors
Besides the MD&A and the financial statements themselves, most annual reports list the members of the Board of Directors. This is part of the impression management. The company wants to show you how experienced and astute the board of directors is, and how meaningful the governance practices of the company are, in order that you might trust the financial statements more.
It's always worth looking at the diversity — or lack thereof — on the board of directors. Things are not as bad as they used to be 50 years ago, but you'll still see an awful lot of people on corporate boards who look a lot like me: older white males.

Principles of Financial Statement Interpretation
Let's turn now to the basic principles of financial statement interpretation. I'm going to be talking about reframing and producing tension in your analysis, the importance of looking at accounting policies, and the concept of earnings quality.
Reframing
Reframing is a concept that I borrow from one of my former Schulich colleagues, the esteemed Prof. Gareth Morgan. It involves changing the frame of reference that you are given on a particular problem, expanding the frame to include new information or focusing in on aspects of the problem that may have escaped attention.
By changing the frame of reference with a set of financial statements, you are altering the window that the corporation has set up for you to look through. One of the ways you can do this is to use external comparisons. A CEO says, "We had 6% profit this year. That's great!" You can look at the average for the industry and find out how that compares. Perhaps the industry average is 10%, perhaps the industry on average lost money. Or you could benchmark the company against a leader in the industry to see whether that 6% profit margin is as good as it seems. Providing context like this frames in new information. This shapes the meaning of the company’s profit and allows you to form an interpretation independent of what the company wants you to believe.
You could also set up internal comparisons — and this is where a lot of the work of financial statement analysis is done. Internal comparisons allow you to juxtapose or compare one figure in the financial statements with another, framing out the noise of less relevant information in order to produce new meaning. They depend on understanding the relevance of the information you have included or excluded.
These reframing techniques are helpful in producing a close reading of the financial statements, looking at it bit by bit, assessing the little details and comparing the insights they provide with the overall impression of the financial statements. This helps you to think critically about the claims made by the company about its financial results. You can see contradictions in the story, and recognize when information that you expected to find is missing. These tensions in and around the financial statements help you to produce knowledge, instead of just consuming the message provided by the corporation.
Tension
I like to think of financial statement interpretation, therefore, as a process of deliberately producing tension. One important way of producing tension has to do with the difference between deduction and induction. Deduction is the classic “Sherlock Holmes” kind of logic. Knowing general principles, such as what to expect to find at a crime scene, allowed Holmes to arrive at conclusions about who committed a crime, and how.

A guy-wire under tension. (credit @Kaffeebart / Unsplash)
Similarly, with financial statement analysis, we should have an idea of what to expect from a company’s financial statements. If they are in an industry that has been shrinking, we will expect to find decreasing profits and perhaps cost-cutting measures being implemented by management. If interest rates have been rising, we would expect to see increasing interest expenses. If supply chain problems have plagued the industry, we might expect to see inventory volatility or rising inventory costs. Given these hypotheses, we would look for specifics about the company that might confirm or deny our hypothesis. This is not just a fishing expedition to prove ourselves right, however, because finding out that our initial hypothesis is wrong is a tremendous insight.
An inductive approach, in contrast, begins with small details in the financial statements and works back up to general conclusions. We dig into the financial details of the company and ask questions about what we're seeing, forming hypotheses not from external context but from internal patterns in the data. So we see, for instance, that inventory has gone up. Ha! That might be because they are producing extra inventory to stock up for an expansion. But it could also be because they ran into sales problems and didn’t cut back on production in time.
Those are two distinct hypotheses about the same little fact that we observed. We can look elsewhere in the financial statements, the MD&A, or at what analysts have said about the company, to see which hypothesis is correct — or at least more plausible.
So the idea is to produce some tension between these different perspectives on the financial statements, working from the top down, and from the bottom up, in order to find contradictions and explore them, use them, to evaluate the story that management is trying to tell.
Accounting Policies
Another thing you need to do when analyzing financial statements is examine the accounting policies. This is often overlooked or done superficially by analysts, but you have to make sure that understand how the financial statement numbers have been calculated. This is not so you can replicate the calculations, because you can’t: there is never enough information to redo the company’s calculations. However, you can at least ensure that if you are comparing two asset values, for instance, you know whether they were calculated in the same way. Naturally, this is important when comparing two different companies, but it’s doubly important when comparing different years of the same company. If you’re looking at five years of a company’s inventory numbers to try to understand the trend, it would be important to know that the company changed how it accounts for inventory in year 4.
But keep mind, when you look at the accounting policies listed in the notes to the financial statement, the company is not going to highlight something and tell you it’s is different than last year. You have to go back yourself and look at what the policy was last year. Only a clause by clause comparison of the accounting policies from last year to this year will let you know if there's been a change.
If a company does change an accounting policy, or has chosen a policy that is different from other company’s in the industry, it's worth asking why. Are they taking advantage of this policy change to accomplish something with their accounting?
Even if the change is mandatory because of a change in regulations, it’s worth asking about the timing, because typically accounting regulations can be adopted voluntarily a year or two before the deadline. Companies only adopt policies voluntarily when there is an advantage to doing so.
And regardless of the reason, adopting a new accounting policy will change the numbers shown on the financial statements, and you have to evaluate how those numbers have been affected by the change in policies.
Now as I said, information about accounting policies tends to be vague, and its also formulaic. Companies never tell us enough about how they do their accounting calculations. However, thinking about the implications of an accounting policy will help you understand the connection between an accounting number and managerial choices. Accounting numbers are never a simple reflection of an objective economic reality.
Earnings Quality
One last thing to keep in mind before we turn to the calculations — and I mention it here because it is very much connected to managerial choices and accounting policies — when you're looking at financial statements, try to evaluate the quality of the earnings. There is a big difference between earnings that are transitory and earnings that are permanent. Transitory earnings are the result of one-time events, either external factors like an economic shock or internal factors like a change in accounting policy. Permanent earnings are earnings that are expected to recur. They are a good predictor of future earnings.
Things like restructuring costs, write-downs or write-offs of asset values, gains or losses on the disposal of assets — all of these management decisions produce one-time changes in earnings, either up or down. They dilute the information content of the earnings number, making it less useful for predicting the future.
The High Level View

McArthur Lake, from Odaray Mountain. This photo was well worth the climb.
Now, let's turn to some calculations. We’ll start with a high level view of financial statements.
Common Size Analysis
Common size analysis is basically taking all of the numbers in a given column of a financial statement and converting them to a percentage of the largest number in that column. On the balance sheet, that's going to be the total assets. You express every number on the balance sheet as a percentage of the total assets that year.
On the income statement, the largest number is going to be at the top, the revenue. You express every number on the income statement as a percentage of the revenue for that year.
What this allows you to do is to compare companies of different sizes. If two companies each have a million dollars worth of profit, which one has performed better? It depends on the revenue they started with. If you earned a million dollars worth of profit off of $5 million worth of revenue, that's a pretty healthy profit margin. But if you earned your million dollars off of a billion dollars worth of revenue, that's not so great. Converting the profit to a percentage of revenue gives different meanings to two otherwise identical raw numbers.
In interpreting a common size analysis, you need to think about the business model of the company, to help you focus on line items that matter the most. Look for lines that tell you about the things that are most relevant to this particular kind of company. It might be accounts payable for a company that is heavily dependent on its supply chain, or cost of goods sold for an industry where competitors operate on thin margins. This is deductive reasoning: you think about the industry and the company to identify what line items are likely to be important, and then you go look at the common size calculations for those items to see how they compare with other years or other companies.
You can also look at changes in weight from one year to another, although the trend analysis that we're going to look at next is probably better suited for that. Whatever you look at, you always want to try to explain what you're seeing in terms of the business strategy of the company. Does it make sense that these particular numbers have these particular weights?
You will want to assess the numbers that you're seeing in terms of the power of the stakeholders, and the underlying economy. Changing levels of accounts payable or long-term debt can tell you about which claimants are gaining more influence on the decisions of the company’s management team.
Let’s look an example of a common size analysis. This is for part of the balance sheet of Saputo for 2015 and the two prior years:

The raw numbers in the first three numeric columns change from year to year, but there are so many digits in each number that it’s hard to see what is going on. If you look at the percentages, however, in the columns on the right, you can see that things are very, very stable. There is almost no change in the numbers, when looked at in relative terms.
With the balance sheet, as I said, a common size analysis compares every number to the total assets. Cash and cash equivalents almost doubles from 2013 to 2015, but when expressed as a percentage of the total assets for the year, you can see that this line is 1% of total assets every year. In relative terms, it hasn’t changed at all.
Trademarks and other intangibles has gone up in absolute value every year, but in relative terms, the common size analysis shows us that it is steadily declining.
The common size analysis doesn’t tell you what to conclude about the patterns that it reveals, but when you combine these indications with other things you know about the company, they can be informative. You’d want to look into what kinds of trademarks and intangible assets a company like Saputo normally acquires (hint: it’s partly to do with milk production quotas in the heavily regulated dairy industry) and how the company amortizes them.
This particular example of a common size analysis doesn’t look very informative because nothing changes very much. However I think the fact that it doesn't change very much is very interesting. To me, this is an indication of very careful management at Saputo. During this time period, from 2013 to 2015, they did a pretty good job of keeping things consistent from one year to the next. It would be interesting to continue our analysis by looking at whether other major dairy companies were able to do the same thing, and at what the economic conditions were in the industry at that time, but for now, we’ll limit ourselves to looking only at the financial statements and the related notes.
Trend Analysis
A trend analysis is when you look from left to right across the columns, instead of up and down as we did for the common size analysis. For this reason, the common size analysis is often called a vertical analysis and the trend analysis a horizontal analysis.
What you are looking for in a trend analysis is indications of growth or decline in a given line item. Each number is expressed as a percentage of the oldest number on the same line, the base year. (You can do a similar thing by expressing every number as a percentage of the previous year, instead of a base year. That’s called a year-over-year analysis. Most of what I’m saying hear applies to a year-over-year analysis, too.
What you are looking for is anomalies. Why, for instance, is the inventory number changing when the accounts receivable didn't? Why did gross profit go up but net profit go down? Why are total liabilities up so much compared to everything else?
You can also compare the trends of this company to the trends that you can observe in the financial statements of another company, or to industry trends gathered from reputable sources. These require careful attention to make sure that the assumptions behind these numbers make them valid comparators, but this approach can tell you a lot about a company. You're always going to want to ask what the possible underlying reasons are for the changes you're seeing over time.
So let's look at an example of this. Here's the trend analysis for Saputo’s income statement for 2015. Everything is expressed as a percentage of the base year, 2013:

Just looking at the top line, so to make sure you understand the calculation, revenue each year is expressed as a percentage of the revenue in the 2013 column. So, of course, the 2013 revenue divided by itself is 1.00, 2014 revenue divided by 2013 revenue is 1.27, and 2015 revenue divided by 2013 revenue is 1.46.
I like to express these as a ratio because it seems more readable to me, but you could just as easily show this as percentages: 146%, 127%, 100%. You could even just show the percentage change from the base year: 46%, 27%, and 0%. I happen to like the ratio format.
These calculations allow you to highlight just how a given line of the financial statement is changing compared to the base year. Interpreting the number depends on understanding what factors might account for the change (or lack of change). How interesting you find the number will depend on how unexpected it is, so it is important to have a good idea of what you expect to see. Some of this expectation can be built in advance by understanding the business model of the company and the economic conditions. If you know the company has been pursuing an expansion strategy, either by acquiring competitors or moving into new markets, then it would be a surprise to see a line item that doesn’t go up. Some of the expectation will be generated inductively as you are reading through the trend analysis, because you’ll see that most lines are static, for instance, but one line will stand out because it’s gone up quite a bit.
Like the common size analysis, trend analysis numbers can suggest an important change when there is really nothing important going on. This is particularly the case when small numbers are involved. If you look at “Other financial charges,” for example, in the figure above, you can see that it has gone up a factor of 4.58. That’s huge growth, but this figure is really just a function of the 2013 figure in the denominator being so small. This line started out very small, and in fact, despite the huge growth it still ended up quite small in relation to both revenue and net earnings. It’s such an insignificant line, in relative terms, that is not going to affect your overall interpretation of the company’s financial statements. The 4.58 figure is only going to interest you if you are doing a highly focused analysis of the company’s financing, because it may well be quite relevant to any interpretations you make there.
The 4.58 figure, so much bigger than all the other trend calculations, is something you will get when the denominator is small. You will get infinite numbers, of course, when the denominator is zero. You can see this in the line for “Gain on disposal of a business unit” in the figure above. I didn’t bother to calculate the trend for that line because the base year for that line is zero. There was no disposal of a business unit in 2013, so I’d just get a divide-by-zero error if I tried to do the calculation. To understand the significance of the negative 25,904 figure on that line, therefore, you need to look closely at the actual disposal (i.e., sale) of the business unit in question. A qualitative interpretation will tell you more than a trend calculation that yields an undefined result. Of course, you could still look at the common size calculation for that year to decide if the gain on disposal was material. (Remember that word, material? A number is material if it is big enough to affect the decision we are making, so a number can be material for some decisions but not material for others.)
What else can we observe in this example? Well, there's a few things that are interesting. One of them is peculiar to Saputo, and it has nothing to do with trend analysis, but it’s worth noting: Saputo doesn’t show its cost of goods sold on the income statement, so you can’t see the gross margin here. We’ll come back to that calculation later, but this is a strange decision for a company that sells inventory for a living.
We already know that revenue was up by a factor of 1.46. This makes the growth in net earnings (net income) curious, because at the bottom line here of the trend analysis, net earnings are only up by 1.27 (or 27%) over the same period. That’s a fairly healthy growth in net income in two years, but it hasn't kept pace with the overall growth in revenues. One of the things we’d want to look for, then, would be what changes in the company's expenses have pulled back some of the company’s growth.
The culprit seems to be the operating cost, which grew by 1.49 compared to 1.46 for revenue. The third line of the income statement, “Earnings before amortization, interest, restructuring and income tax,” is the difference between the two larger numbers above it. This line only grew by 1.23. That’s even less than the growth in net earnings. This means that the second line on the statement accounts for all of the disappointment you might feel about Saputo’s net earnings. The income statement tells us that we can learn more about the expenses on line two by turning to Note 5. I’m not going to do that right now, but feel free to go have a look yourself. It will be in Saputo’s 2015 annual report. There’s a link at the bottom of this page.
Ratio Analysis
Having learned a thing or two from the high-level calculations of the common size and trend analyses, it’s time for us to look at some more focused financial ratios.
I like to categorize these ratios into different tool sets, based on the three things you want to assess in a financial statement analysis: the financial position of the company, its financial performance, and its cash flows.
Think about evaluating an athlete who is preparing for the Olympics. The financial position of the company is analogous to the body of the athlete. You expect a weight lifter to be strong, you expect a marathon runner to be lean. If they've got the wrong body mass for the sport that they're in, they're not going to do very well. Financial performance is akin to the actual results of the athlete in their event. How fast did the sprinter run? How much did the weight lifter lift? How well did they use their body to achieve their result? Cash flows are like the diet of the athlete. Are they taking in the right fluids and eating the right food? I don’t want to extend this metaphor too far, mind you, so I’m only mentioning the cash flows coming into the company…
Financial Position

A bunch of assets with very little in the way of liabilities (credit: Nigel Msipa / Unsplash)
So the financial position of the company, then: what resources does the company have to meet the obligations that it's got, and to achieve the strategy that it’s pursuing?
It's useful to distinguish between liquidity and solvency when you're looking at the financial position of the company. Illiquidity is not having enough cash to meet the operational needs of the company over the short term. Insolvency is when you don't have enough resources to pay off all of your debts. That's a longer term kind of a problem, but it's important to realize that a company can be solvent but can still die from illiquidity. If you have the prospect of producing enormous profits by the end of the year, but halfway through the year you run out of cash to pay your employees, everything will come to a grinding halt.
Both of these situations are often resolved by negotiations, as opposed to legal decisions or regulatory rules. The results of these negotiations depends on who has the power. Of course, power can come from the threat of legal action or regulatory penalties, but it can also come from a claimant having something that the company desperately needs, such as labour or a scarce component of inventory. Whether it’s the bank, the union, or some supplier that has this leverage over the company, they can often achieve an outcome that favors them over other claimants who have less power. Accounting plays its role by highlighting and quantifying the importance of the claims on a company.
Liquidity
To analyze liquidity is to answer the question of whether there's going to be enough cash in the company to pay the upcoming bills. And by cash, we need a looser definition than simply money in the bank, because not all upcoming bills need to be paid with the cash that is already in the bank.
If you look at the current ratio, which is the most basic of the liquidity ratios, you are comparing all the current assets to all the current liabilities. Current assets are the ones that are going to convert into cash (or reduce the expenditure of cash) this fiscal year. Current liabilities are all the obligations that are coming due this year. If you've got enough current assets to cover all of those liabilities, you're in good shape. For the current ratio, the bigger the number, the better, but you certainly want it to be greater than one.
The quick ratio provides a more restricted, more conservative, look at liquidity. It includes all the current liabilities, but it only includes the current assets that are already liquid: cash, liquid investments, and accounts receivable. Liquid investments would include things like marketable securities (stocks and bonds) that could be sold quickly to convert them into cash. A/R is included because you would normally expect customers to pay their bills without having to expend too much effort chasing them down. Because current assets are listed in order of liquidity, you tend to see cash and accounts receivable up near the top. Partway down the list is inventory. Inventory is not considered a “quick” asset because it still has to be sold, and anyone who has worked in sales will tell you that takes a lot of work. If there are assets listed above inventory, such as financial investments or notes receivable, you can usually assume that they can be included in the quick ratio.
Anything listed after inventory is generally considered illiquid. They are not going to be of any help in paying upcoming bills. For instance, no matter how long you wait, prepaid expenses are never going to turn into cash. They arise because the company has already parted with cash. The quick ratio can be less than one without raising a red flag, but you want it to be as close to one as possible, or even higher. A big change in the quick ratio from one year suggests that things are getting dramatically worse or better, in terms of the company’s capacity to pay its bills, so it would always be worth investigating to see what has caused such a change.
Let's look an the example of Saputo 2015, again:

The current ratio, which is the ratio of the two totals in this figure, jumps up to 1.7 in 2015, from 1.1 the previous year. It had been stable between 2013 and 2014, so what is driving the big change? If you just eyeball the lines in the figure, you'll notice that the cash and inventory numbers went up quite a bit compared to the previous year. That might be natural if the company is growing. On the liabilities side, there is a drop in income taxes payable. The biggest change, though, is the drop in bank loans and the current portion of LTD. This suggests that the company is aggressively repaying its debt.
I encourage you to investigate this further. You’ll want to look at Notes 9 and 10, as those lines indicate. I’ll drop a note at the bottom of this lesson to tell you what I found there, but please go investigate it yourself and see what you think. Basically, we want to know whether this big increase in the current ratio is something lasting or whether it’s just transitory. If it’s lasting, then that would change any decisions we might make that depend on the company’s liquidity — such as whether to extend them credit as a supplier, or whether to buy their debt instruments as an investor. It it’s transitory, then we would be more hesitant to do those things.
The quick ratio can sometimes require judgement because you have to decide what counts as a quick asset. For Saputo, it’s obvious. There is nothing listed above inventory besides the cash and the A/R, both of which are typically considered quick assets. There is nothing listed after inventory that would give us pause. Perhaps the income taxes receivable could be considered quick if you could learn mor about when it is due to be received by Saputo, but the amount is so small that it’s not worth worrying about. Including it would not change any decision we might make with the quick ratio.
If you add up the two quick assets and divide them by the current liabilities, you get a quick ratio that varies from 0.5 to 0.7 over the three years. That’s not a lot of change, so there are no red flags here. If anything, the slight increase to 0.7 is a welcome improvement. Saputo looks pretty healthy from a liquidity perspective.
Interest Coverage Ratio

Liquidity and solvency both have to do with the ability of a company to meet its obligations. Liquidity looks at this from a short-term perspective, while solvency looks at the long term. In between these two poles is the question of whether the company can, in the short term, handle the interest on its long term debt. You can look at this in terms of cash flows — does the company generate enough cash from operations to make interest payments — but you can also look at it from the perspective of profitability. The interest coverage ratio does just that. It’s one of the common calculations used to assess the ability of a company to deal with its debt levels.
The interest coverage ratio tells you how much profitability remains by the time you get down to the interest expense line on the income statement. It often appears just before the income tax expense. This ratio, therefore, starts at net income and works back up the income statement: take net income, add back the income tax expense, and then add back the interest expense. That sum, when divided by the interest expense, will give you the interest coverage ratio. A ratio of 2, for example, would indicate that the company has twice as much profit as it need to cover its interest. The higher the ratio, the better. Less than 1 is definitely a problem.

Here is a variation on the calculation, using EBITDA as a shorthand for the numerator we’re after. This is useful if you have already calculated EBITDA. I usually haven’t, because I think EBITDA is a misleading number, as I’ll explain below.
The main point of showing you two ways of doing the calculation is to try to wean you off the idea that there's always one official way of doing a financial ratio calculation. In practice, there are variations on almost every one of the calculations we're looking at in this lesson. Your employer, for instance, may have a proprietary way of doing a calculation, so if they tell you to use a specific formula, just do what you’re told but think about the assumptions underlying that formula. You need to be aware of the nuances of each way of doing a calculation and decide which version is most appropriate for you, given the company you're looking at and the decision you are trying to make.
But let's look at how these calculations play out. The general idea is to start with the net earnings and then back up to some point above the interest expense, to see how much margin is left when you get to that point in the statement. The interest expense shown here is only the interest on long-term debt, and that’s fine for our purposes. However, Saputo also has current liabilities that incur interest expenses, so let’s keep in mind that we’re not seeing the whole picture here.
There’s another line here, other financial charges, that seems relevant, because our more general question is about Saputo’s ability to handle its debt, and this is definitely a cost of financing. If you look into Note 13, as the line suggests, you won’t find much detail about what “other financial charges” means. It’s probably commissions and fees paid on the issuing of its debt, because Saputo doesn’t just borrow from the bank. It also issues bonds, as you discovered when you took a look at Note 10, which we referred to when discussing the current ratio. Bonds are expensive to set up, so you might want to include them as part of the interest expense in both the numerator and the denominator if you are concerned about the ability of Saputo to deal with its broader borrowing costs. I’m going to leave them out, though, on the assumption that the whole point of arranging bonds is to reduce your finance costs and perhaps to distribute your debt more widely, so that you’re not handing the banker too much power over you. Those are both good reasons to incur finance costs, so I’m going to leave them out and just focus on the interest expense.
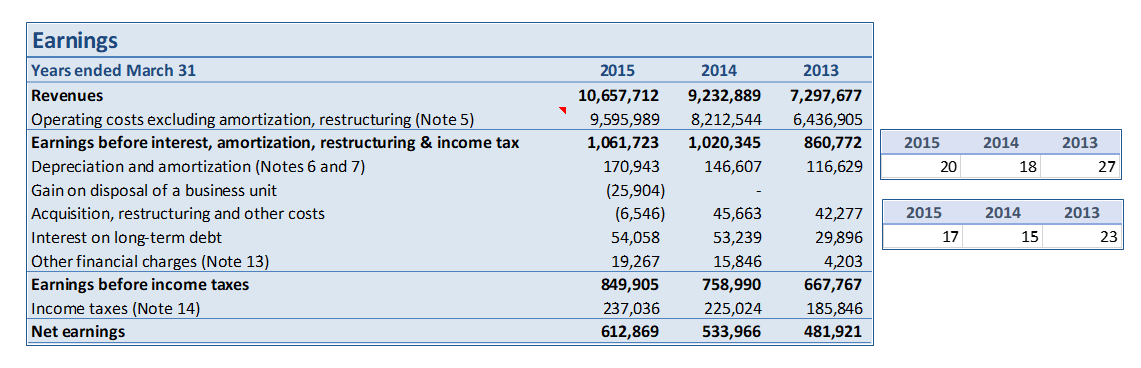
Where does this leave us, in terms of the calculation? Well, you do the calculation manually by taking the net earnings number and adding back interest and income tax expenses, you get an interest coverage ratio of 17 for 2015, 15 for 2014, and 23 for 2013. If you do the calculation using EBITDA, which I calculate by adding back the depreciation and amortization expense, along with the other ones I already added back, then the absolute numbers a higher at 20, 18, and 27, but the pattern remains the same: a fairly big drop from 2013 to 2014, but not much change from 2014 to 2015. With numbers this big, it’s clear that Saputo has no problem paying for the cost of borrowing its long-term debt. The only interesting question is why there was a drop from 2013 to 2014. It appears to be driven by the lower interest expense in 2013. To find out why that is, you’d have to dig into the 2013 and 2014 annual reports, which I haven’t posted here.
By the way, if you are looking for Saputo to tell you it’s EBITDA, don’t be misled by the line called "Earnings before interest, amortization, restructuring and income tax." It excludes too much. In particular, it excludes the gain on disposal of a business unit and the acquisition and restructuring costs. Saputo is a multinational company whose business model is to grow geographically through acquisitions. If you exclude the cost of doing this, you’re excluding things that are integral to Saputo being Saputo.
Leverage
Leverage is about how the company has financed its assets. You can raise financing for assets by selling stock on the stock exchange. You can do it by operating your business at a profit and reinvesting your earnings rather than paying them out as dividends. Those are both using equity to to finance your assets. You can also rase financing by borrowing, and that’s where leverage comes in. Leveraging means borrowing to multiply the impact of your equity on the business.
Leveraging 1:1 means you can invest twice as much in assets, generating even more profit than you could if you only used equity financing. Leveraging 2:1 means you can invest three times as much in assets. Keep going! It’s fun!
So why don’t companies just borrow huge wads of cash and multiply their equity by a factor of 10 or 100?
Because of risk. When you borrow, you are 100% guaranteed to have to make interest payments. When you invest in assets, you are not guaranteed to make a profit at all. You might even post a loss.
So how do you decide when you’ve borrowed enough? In simple terms, you should keep borrowing as long as the expected return on another dollar of assets is higher than the interest rate on another dollar of borrowing.
Assets generally have a diminishing rate of return. You invest in the best opportunity first, because you’re not stupid. If you still have capital left, you invest in the second best opportunity you can find. And so on. Eventually, you run out of good ideas or good markets, and continuing to invest will not generate much more profit per dollar of investment.
Debt follows the same rough pattern. The first bank you talk to will lend you money because you don’t have any debt. You are 100% equity financed. You have a lot of skin in the game, so the bank figures you are a low risk borrower. The second bank you talk to says, hey wait a minute, you already have obligations to that first bank. We will lend you money, but only if you give us a lien on something like your inventory, and only if you pay us a higher rate of interest to compensate us for the risk. The third bank says no, so you turn to the financial markets to issue some debt. Maybe you get some curious punters, maybe you don’t. If you keep on borrowing, eventually you are talking to loan sharks who will only lend to you at exorbitant interest rates.
You need to stop borrowing when your marginal rate of return on assets meets your marginal cost of borrowing. Generally, this is well before you talk to any loan sharks.
Leverage is going to amplify your returns on equity. If you are profitable, it can generate more profit for the amount of equity your shareholders have invested. But if you start losing money, leverage will make your return on equity even more negative.
Keep this in mind. Leverage doesn’t just produce a more of a good thing. It can also produce more of a bad thing.
Not all leverage is created equal, of course. To understand a company’s leverage, you have to closely look at the capital structure of the company. How is the company financed? What is the debt makeup? Is it bank loans? Is it bonds? Is it notes? Is the debt owed to one particular party or is it made up of bonds circulating on the stock exchange. The concentration of debt changes the leverage debt holders have over the company. Leverage cuts both ways.
You also want to look at the company’s equity. How much of it comes from retained earnings? How are the shares distributed? Are their preferred shareholders? Is there a majority shareholder? All of these factors affect your interpretation of the company’s leverage situation, and of the solvency ratios that you calculate. Let’s look at those next.
Solvency

The debt-to-equity ratio is the most common solvency ratio. It sounds deceptively simple, just debt divided by equity. There are several variations on the calculation, though, so you have to think carefully about what you're trying to accomplish with the ratio.
The basic debt-to-equity calculation is something you can just eyeball when you look at a balance sheet. Just divide the total liabilities by the total equity.
A more nuanced version only includes interest-bearing debt — formal bank loans or bonds that require the company to pay interest. You may or may not find this nuance compelling. It really depends on whether you are evaluating the overall risk of the company or whether you are specifically wondering whether to invest in the company’s bonds.
Another nuanced version looks only at the net debt. For this, you take the interest-bearing debt of the company — so excluding the accounts payable, for instance — and then subtract the cash and cash equivalents that appear on the left hand side of the balance sheet. This gives you the net debt figure in the denominator, which is useful I suppose if the company is cash-rich. But you have to wonder, why only factor in the cash? Why not also include the accounts receivable? As we saw on the calculation of the quick ratio, accounts receivable is a quick asset, so why not include it? And if you're going to do that, why not also include the accounts payable in the liabilities? It all begins to fall apart very quickly if you look at it too closely.
The point is, these are all subtly different variations on the D/E ratio, and whichever one you use, you need to understand the assumptions and limitations of the way you are doing it. You might want to consider looking at multiple versions of the calculation to see which one makes more sense for you, assuming you have the time to do so. Which one generates a more insightful picture of the company's debt and equity, for your purposes?
Long-term debt to equity is yet another version of the net debt. It ignores current liabilities, and it might be useful if you are trying to make a stark comparison between the long run solvency of the company and its short-term liquidity.

The final solvency ratio to consider is debt to assets. You could, of course, run through multiple variations by including, for instance, only interest-bearing debt or long-term debt. The point of this calculation is that it's the only one you can use when a company gets into a negative equity position. You can’t make sense of D/E if the “E” is negative. How do you get a negative equity position? It’s easy. Start by selling a million dollars worth of shares and then lose more than a million dollars in the first few years of operation. That’s the basic recipe. Companies can survive negative equity situations if they have a bright future that the shareholders and creditors believe in. That can happen if the company is developing a cool new product. Otherwise, negative equity situations lead to insolvency.
The debt to assets calculation always involves positive numbers, so it's useful to interpret trends from one year to another in negative equity situation. Even one year with negative equity will make the trend on D/E impossible to interpret. So, this is just another tool to have in your toolbelt as you're trying to assess solvency.

Here are my calculations for Saputo for 2013 to 2015. I’ve not used net debt because Saputo’s cash position is so small relative to its debt and equity. The D/E ratio is dropping over time. You will want to ask why. Is it because the equity is going up or the debt is going down? What is driving the movement in the ratio?
Long-term debt to equity shows the same pattern. For that, I included all the long-term liabilities. You could do a version of the D/E calculation using only Saputo’s interest-bearing debt, and that might be revealing. You’d include the bank loans and current portion of LTD, but exclude the deferred income tax liability. I haven’t done the calculation, but feel free to play around with it using the spreadsheet posted below.
As for the debt-to-assets ratio, it’s fairly stable for Saputo. If the D/A ratio is stable but D/E is dropping, then maybe what's changing is the equity in the D/E ratio, rather than the debt. What would you look at to test that hypothesis? (Hint: it was the last thing we talked about before turning our attention to Ratio Analysis.)
Financial Performance

Wheelchair racer (credit: @onesixtieth / Unsplash)
To look at the financial performance of the company, you are really asking, not simply what did the company do, but what did it do given the resources that it has at its disposal, and the opportunities that it has. You're trying to understand whether the company is able to produce those performances in relation to competitors.
The picture that's shown there of the wheelchair racer is provocative for me, because you would never want to compare a wheelchair athlete with an able bodied athlete. Not over more than 400 meters. There's just no way the able bodied athlete would be able to keep up.
Gross Margin

The place to start is the gross margin ratio, which is your sales minus cost of goods sold, divided by the sales. In other words, how much is left over after you've factored out the cost of the things you sold? You can do this as a raw calculation of gross profit, and most income statements do that for you, but expressing this as a ratio allows you to compare one year to another, or one company to another. Multiplying the ratio by 100 gives you a percentage, which is the most common way of expressing gross margin.
As with most financial analysis calculations, gross margin ratios vary considerably by industry. Clothing stores have very high margins. Grocery stores have very low margins, at least on food. For razors and rubber gloves, the margins are much higher. So to be profitable as a grocery store, you have to do different things than you would as a clothing store. Context matters when interpreting numbers.
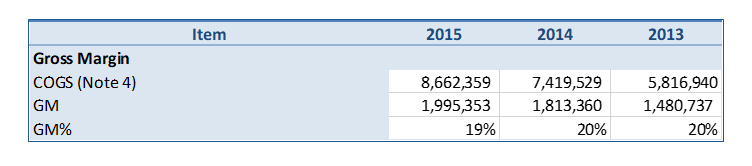
This is the gross margin calculation for Saputo. What’s weird about Saputo is that they don’t show cost of goods sold on their income statement. You've got the Saputo annual report for 2015, so I suggest you look at Note 4 to see just how far a reader has to dig to find the cost of goods sold.
I've taken the number from Note 4 and plugged it into the spreadsheet here, calculating the gross margin and the gross margin ratio, expressed as a percentage. You can see that there's very little change for this company over time. It's a very stable company, and quite profitable. A drop of one percentage point, from 20% to 19% gross margin is relatively insignificant for a company like Saputo because they're supplying milk products and cheese to grocery stores. They are not themselves a grocery store. For a grocery store, which has lower margins, a drop of one percentage point from, say, 4% to 3%, would be of greater concern than Saputo's drop from 20% to 19%.
Profit Margin

The profit margin is the bottom line of the company, so you're just taking the net income figure at the bottom of the income statement and dividing it by the sales at the top of the income statement. It’s common to express this as a percentage.

The calculations for Saputo are fairly straightforward and you can see again, it's a very stable company. Not much change over time. The company, by all appearances of the financial statements, seems to be quite well managed and quite stable.
ROA
The return on assets calculation is fascinating to me because you really have to think about what's going into the calculation. The simplest form would be just to take net income and divide it by total assets. That’s literally the return on top of the assets, but it’s not how I want you to do it.

There are two nuances in the version of the calculation that I want you to use, shown here. The first is that you should really be using the average total assets in the denominator, not just the total assets at the end of the year. That's because income is produced with the assets that were at the company’s disposal during the fiscal year, not the assets the company had at the end of the year.
Ideally, you would take some kind of an integral that adjust for the change in total assets each day, but that information is not available to you. The best you could do with a public company would be a quarterly calculation. However, a simple approximation of the assets at the disposal of the company throughout the year is to take an average of the total assets at the beginning of the year and the total assets at the end of the year. That information is readily available on the balance sheet, so use it.
Doing this accounts for the growth of the company, because the total assets can increase considerably from one year to the next. If a company is quite stable, however — if there's no material change in the total assets — then it would be quite acceptable to use the ending total assets. I suggest using the average all the time, though, to develop good habits.
There are nuances in the numerator of the calculation, too. Here I have added the after-tax interest expense back into the net income figure. This isolates the return on assets — what the company did with the assets at its disposal — from how those assets were financed. If the company financed its assets with equity, that would produce a higher net income than if it financed them with debt, because net income is affected by the interest paid on debt but not by dividends paid on equity. Interest is an expense, but dividends do not appear anywhere on the income statement. They come straight out of retained earnings on the balance sheet.
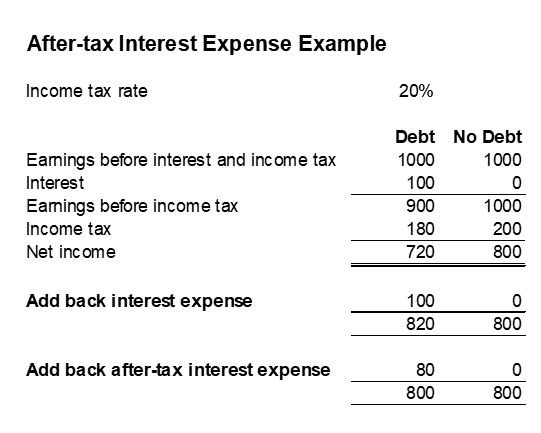
Here's how the after-tax interest expense is calculated. This is a crude example, but imagine that you've got two companies that are identical in every respect, except that one is financed by a combination of debt and equity, while the other has been finance entirely with equity. Both companies have an income tax rate of 20%.
Let's assume that the companies are exactly as efficient at using their assets to produce profit. The earnings of both companies, when you get to the line where the interest expense would be, are $1000. And let’s assume, for the sake of simplicity, that the company with debt had an interest expense of $100. That would leave it $900 of taxable income. The company with no debt would have no interest expense, so the entire $1000 would be taxable. Income tax on $900 at the 20% tax rate is $180, leaving $720 of net income. Income tax on $1000 is $200, leaving $800 of net income. The company with no debt is more profitable, so you cannot use profit margin to assess which company is better at using its assets. We already know that the companies are equally good at this. The only difference is their capital structure.
For the sake of argument, let’s add back the entire interest expense to the first company to see what happens. If we do this, we overcompensate. We end up with a figure of $820. Now the company with debt looks like its better run.
To create a fair comparison, you have to adjust for the fact that interest expense is tax deductible. The tax savings on the interest expense are the expense times the income tax rate, $100 x 20%, or $20. To adjust for this tax savings, we therefore don’t add back the entire interest expense, we add back the after-tax interest expense, which we get by multiplying the interest expense by one minus the tax rate, so $100 x (1 - 0.20) = $80. Doing this leaves the adjusted return for both companies at $80.
For any company, then, adjusting the net income by adding back the after-tax interest expense will give you a return on assets value that is independent of the capital structure of the company. Obviously, if the company has very little debt and therefore negligible interest expenses, this effect of this adjustment will not be material. However, if you are comparing a company that is heavily leveraged to another company that is not, this little wrinkle in the ROA calculation will give you numbers that are easier to interpret.
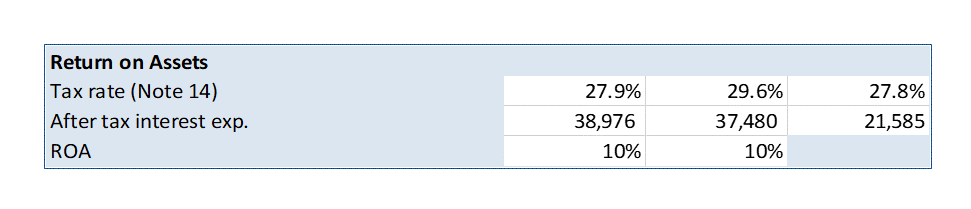
Here is the calculation for Saputo for 2015. We can find the tax rate in Note 14. I highly recommend using the statutory tax rate disclosed by most companies in their notes. In a pinch you could calculate the effective income tax rate, which is the income tax expense divided by the taxable income, but the income tax expense in any year is so heavily influenced by accrual adjustments related to asset amortization that it's not very useful for this purpose.
The statutory tax rate for Saputo was around 28% for these three years — Saputo is based in Quebec. The after tax interest expense is shown on the second line, starting at $21,585 and then jumping up to around $38,000 the next two years.
We end up with a return on assets of 10% for 2014 and 2015. The company is achieving the same performance with its assets each year. Notice that I don't have any calculation for that third year, 2014. That's because the calculation uses average assets in the denominator, and the balance sheet in my spreadsheet does not go back to 2013. When you are building a spreadsheet like this, don’t just copy the formula into all the columns. You’ll end up with a much higher ROA figure in the earliest year, because you will be inadvertently calculating average assets for that year using a zero for the prior year.
So how many years is enough when you are building a financial analysis spreadsheet? Including too many years can produce meaningless comparisons, because so much changes in technology and in the economy over the course of a decade. I find that three or four years is about right for helping me understand the trends in a company’s financial results.
ROE

While the return on assets calculation looked at what the managers did with the assets, the return on equity calculation looks at whether shareholders are getting a good return on their investment. It obviously depends on what managers did with the assets, but it compares this result to the amount of equity.
By convention, ROA is about the return to the common shareholders, so if a company has preferred shares, we need to factor that out of both the numerator and the denominator. In the numerator, any preferred dividends paid by the company need to be subtracted from net income, because preferred dividends are taken out of retained earnings. They are not an expense on the income statement. For the denominator, we need to eliminate the equity financing provided by the preferred shareholders, so we subtract the par value of the preferred shares from the total equity. Ideally you’d subtract the actual proceeds from issuing the preferred shares, rather than their par value, but that information may not be available.
These adjustments will obviously have no effect on ROE for companies that don't have any preferred shares, so check the capital structure of the company and the notes to the financial statements to find out whether there were any preferred dividends and preferred shares.
Here again we are using an average in the denominator, for exactly the same reasons I discussed in relation to the ROA calculation. You want to use the average common shareholders equity.
Why don’t we adjust for after-tax interest expense here, like we did for ROA, and why don’t we adjust ROA for preferred dividends like we do for ROE? The answer is that ROA, as I use it, gives me figures that are independent of capital structure. That allows me to evaluate the ability of the company’s managers to get the most out of the assets. Adjusting ROA for preferred dividends would make no sense because preferred dividends are a consequence of capital structure. ROE, on the other hand, is for evaluating the return to common shareholders given the capital structure of the company. Adjusting for interest expense would defeat that purpose.

Turning to our example of Saputo in 2015, there were no preferred shares and no preferred dividends, so our calculation is rather simple. We can see that ROE drops slightly from 2014 to 2015. Why is that? Well, It could be that the net income dropped, or it could be that the equity went up. So why is that? One of the things to think about is that the ROE is driven by the equity calculation and the equity calculation has the retained earnings in it.
So you would expect that all things being equal, if the company continues to generate net income and retain that earning in its equity section, that if it doesn't do anything with that equity, if it doesn't reinvest in more assets, then it's going to continue to produce the same net income with the same assets, but the equity is going to grow and grow, and therefore the ROE is going to decline.
Dupont Analysis

Here is a variant of the ROE that's breaks the calculation out into three factors: the profit margin, the asset turnover ratio, and the equity multiplier. In this sequence of divisions and multiplications, you can see that the sales figures cancel each other out, as do the assets. This calculation, then is equal to profit divided by equity, which is a plain vanilla ROE calculation.
I say plain vanilla because this version of the ROE doesn't have the nuances that we've just looked at. It doesn’t adjust for preferred dividends and shares, and it doesn’t use of an average in the denominator. Despite these limitations, it can help you understand what might be driving any changes you observe from year to year in the more nuanced ROE calculation.

Here's the DuPont analysis for Saputo. The profit margin is just profit divided by sales. It confirms what we saw before: the profit margin is quite steady. We saw those 6%, 6%, and 7% figures earlier.
The next part of the calculation is the asset turnover ratio, which is sales divided by total assets. In other words, how many times during the year are the assets generating their equivalent value of sales? In Saputo’s case, the asset turnover ratio rose slightly from 1.4 in 2014 to 1.6 in 2015. By 2015, it was generating more sales per dollar of assets, which is good. However, the effect is minimal, and merely compensates for the slight drop in profit margin.
Combining those two figures together — profit over sales, times sales over assets — gives you profit over assets, which is a basic ROA calculation. This unnuanced version of the ROA calculation is quite stable over those years, just like the nuanced version was. However, these numbers are slightly lower than the nuanced ones, 8% and 9% instead of 10%. That’s probably caused by the different denominator. The nuanced version used average assets on the bottom. For a growing company, that’s going to be a lower figure than the year-end assets, which is why it yields a ratio that’s a bit higher.
Now you take the ROA result and multiply it by the equity multiplier, assets divided by equity. This is different from the other leverage calculations we looked at, D/E and D/A. This is assets divided by equity, A/E. So in other words, how much has the company leveraged its equity into assets?
You can see from the figures that it’s the equity multiplier that changes the most. The first two parts of the Dupont analysis were quite steady, and the little drop we saw in profit margin was canceled out by the slight improvement in asset turnover. The equity multiplier, however, drops from 2.3 to 1.9 over the two years. This is the component that's driving the drop in Saputo’s return on equity. Although these ROE figures are different from the results of the more nuanced ROE calculation, they are moving in the same direction, so this tells us that the ROE is dropping because the company is less leveraged in 2015 compared to the previous two years.
We could go back to our leverage calculations and see if what we learned there resonates with what the Dupont analysis tells us. Our leverage analysis, if you recall, told us that bank loans and the current portion of LTD went down, even though overall LTD was relatively unchanged. This was because the company was replacing its LTD with new bonds issued at a lower interest rate. The main driver of the drop in leverage, therefore, was the increase in equity. This resonates with the drop in the equity multiplier here, in the Dupont analysis.
So what is driving the increase in equity? It’s not just earnings, even though the company’s profits are healthy. I suggest that you look at the statement of comprehensive income for see what’s driving the change in equity, and think about our discussion of “other comprehensive income” in the lesson on equity. I’ll leave a comment at the end of this lesson to share my thoughts on the matter.
EPS

Earnings per share is a curious calculation because it's susceptible to manipulation by inside shareholders. The numerator, net income adjusted by the preferred dividends, is something we saw in the ROE calculation earlier.
The technical part of the calculation is the denominator, weighted average number of shares. This is calculated by looking at the number of shares that were outstanding in the company over the course of the fiscal period. If the company didn't sell or repurchase any shares, then that's going to be a constant number. But if the company issued or repurchased shares part way through the year, the weighted average will depend on when during the year that happened. If the company issued shares towards the end of the year, then for most of the year, the number of shares was relatively low. If it issued them near the beginning of the year, then for most of the year, the number of shares was high. The “weight” in weighted average number of shares is the number of days during the year that the shares were outstanding.
It's the opportunity to repurchase shares that makes EPS subject to manipulation. As we saw with Apple in an earlier lesson, Apple was borrowing cash to buy back shares on the stock market. This reduced the number of outstanding shares, which drives up the earnings per share. The main beneficiaries of this policy were insider shareholders, the CEO and the board chair in particular, who saw their percentage ownership of Apple go up. Share buy-backs concentrate the ownership position of the remaining shareholders.
One little nuance in the EPS calculation is that it is generally calculated twice, with two different denominators. Basic EPS uses outstanding shares in the denominator; that is, the shares that have been issued and are currently held by shareholders. The other version is diluted EPS. It adds to this denominator all the possible shares that might have to be issued due to executive stock options or convertible hybrid securities. This version of the calculation is probably more important to common shareholders because dilution is what happens when other people exercise their right to obtain common shares. Executives will be likely to exercise their stock options if share prices are going up. Investors who hold convertible bonds or convertible preferred shares — if the company has issued any of these — might convert them into common shares at an agreed upon rate, if the conditions are favourable. As with stock options, this is generally going to be when share prices have risen, because that makes the common shares more valuable than the convertible security. Anytime someone exercises a right to common shares, this reduces the percentage ownership of the other common shareholders somewhat. That’s why the diluted EPS is never higher than basic EPS. Because executive stock options are such a popular form of compensation, diluted EPS is usually lower than basic EPS.
Other Commonly Used Ratios

The price to earnings ratio is share price over earnings per share. It’s also a curious calculation, because the share price is driven by the market and the market is driven by expectations of high earnings. The price to earnings ratio is therefore future expectations divided by past performance.
I'm not sure I fully understand what kind of information this provides. Supposedly, a high P/E ratio indicates that people are bullish about the company. But does this mean that you should buy the shares or sell them? I don’t know, and neither does anyone else. A Forbes article suggests that the P/E ratio is “not a sound indicator of the short-term price movements of a stock or index,” and that there is actually evidence of an inverse relationship between P/E and future returns.
The same Forbes article suggests that the P/E ratio can be used to assess the valuation of a stock: “The higher the [P/E] ratio, the more expensive a stock is relative to its earnings.” Well that’s not telling me anything! That’s just the definition of the ratio.
In summary, the P/E ratio is useless but it’s a popular thing to talk about because it creates the impression that you understand corporate finance.

The dividend payout ratio looks at the common dividends that were paid out of a company’s net income. You would presumably use this to compare one company to another. What it tells you is ambiguous, though. Is a high number better? Perhaps. If the ratio is too high, though, the dividend payouts might be unsustainable. And if the ratio is low, maybe that’s a good thing because it could indicate the company is reinvesting its net income. Cool. Tastes differ.
These are just a couple of the more common ratios you’ll see people talking about. Use them if they're useful to you, ignore them if they're not.
Remember that anything can be a ratio. You can take any two numbers on the financial statements and divide one by the other and come up with a ratio. If that calculation makes sense in a particular circumstance, you’ve just created some information. Interpret it properly, and you’ve just created some new knowledge.

Some calculations are only common within a particular industry, and of little significance in others. A technology company, for instance, might want to brag about how much is spends on research. The research expense ratio is research expense is divided by sales. Perhaps this can tell you whether the company is spending enough on R&D.
But if the company is investing in R&D successfully, then wouldn’t it capitalize those development costs. If that’s the case, those costs would not show up on the income statement as an expense. So what does a high research expense ratio tell you? Maybe it just tells you that the company has so much money that it can afford to spend it researching ideas that don’t work out. One could argue, if one was cynical, that this is the case at Apple, since its capitalized innovation costs are primarily from acquisitions, not from its own R&D. I suppose this is true of almost every technology giant, though.
I don't know what else to say about the research expense ratio other than that it requires an awful lot of interpretation. You can't simply assume that a high R&D ratio is better than a low R&D ratio. You do want to see a technology company investing in new ideas, otherwise it’s just milking a set of assets that sooner or later are going to become obsolete. But who’s to say if doing your own research is better than waiting to buy a smaller company that has done the research for you.
That’s all I’ve got to say about analyzing financial performance. Let’s turn our back on the world of accruals and look at what a company’s cash flows can tell us.
Cash Flows

Donuts, breakfast of champions (credit: Bethany Newman / Unsplash)
If you think of cash flows as the diet of the company, you want to ask where the nutrition is coming from? There are lots of ways that a company to obtain cash, but eventually, when a company has matured past the start-up stage, you want it to be generating cash from its operating activities. Anything else is not healthy in the long run.
We've looked at the interpretation of the cash flow statement before. You’ll recall that it’s helpful to look at whether the operating, investing, or financing activities of the company that are generating or using cash. A start-up, for instance, will have positive cash flows from financing, because it’s been issuing shares or taking on loans. A mature company will often have negative cash flows from financing, as it pays off debt and pays dividends to shareholders.
Whatever pattern you see in the cash flow statement needs to be interpreted in relation to the strategy of the company. You may want to go back to the lesson on the cash flow statement if you want to refresh your memory.
In interpreting the cash flow statement, as with any financial statement, you want to be asking critical questions. The specific questions you should ask depend on the perspective you're taking. What is it that you want the company to do with its cash, from your perspective? If you are a union negotiator, you will be interested in whether the company is generating enough money to pay wages or fund the pension plan. If you are thinking strategically about the company trying to assess its growth potential, you will want to ask whether it's able to fund a potential expansion. If you are worried about its debt situation, you will want to know whether the company is generating enough cash to pay interest charges and retire its long-term debt. And if you are an investor who is relying on dividends, you will want to know whether it's going to have enough money left over at the end of the day to pay you the dividends.
There are so many other possible questions that we could go on forever. Just keep this in mind: you're always going to be interpreting cash flows in relation to a specific question, not just in relation to the company's overall strategy. There is no such thing as “good” cash flows. There is only “good in relation to a specific goal.”
Cash Requirements
One way of looking at the cash flows of a company is to consider its operations. The set of calculations I’m going to show you really only make sense for a manufacturing or retail company because there are inventory calculations involved, but with this caveat in mind, let’s look at cash requirements.
A manufacturer or retailer has three major components to its working capital: inventory, accounts receivable, and accounts payable. And so you can understand a lot about the company by looking at the way it takes advantage of each of these components.
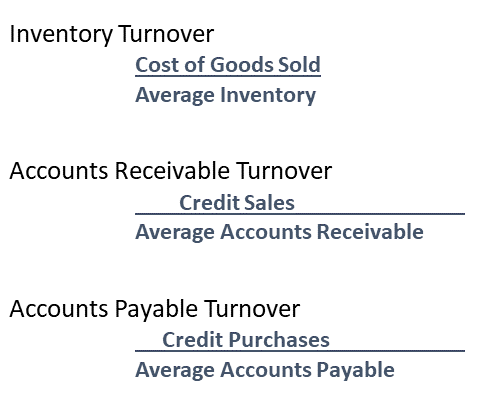
Inventory turnover is how frequently the company runs through its inventory. If inventory is bloated, this number will be low. If inventory is lean and efficient, this number will be high. But obviously, if inventory is too lean, there is no buffer to deal with minor supply chain delays or brief surges in customer demand.
Inventory turnover is calculated as cost of goods sold divided by average inventory. As with the ROA and ROE calculations, you want to use the average on the bottom because the cost of goods sold (just like the “return” in ROA and ROE) is for the entire year. This number is going to be industry dependent, of course, because companies like wine or whisky producers hold onto their inventory a long time, while grocery stores turn over their produce on almost a daily basis. Wine improves with age. Lettuce does not.
Accounts receivable turnover tells you how frequently the company collects from its customers. It’s credit sales divided by the average accounts receivable. For a lot of companies, credit sales is quite obvious. A business-to-business company would extend credit on pretty much all of its sales. A pure retailer would sell almost entirely on a cash basis. (If a customer uses a credit card, that’s not a credit sale to the store. The store gets paid right away. It’s the credit card company that is extending credit to the customer.) For a company like Apple, it's a little more difficult to figure out what the credit sales are. It sells to other businesses and it sells directly to consumers. You have to go digging in the notes and hope to find what proportion of the company’s revenues are sold on credit to business customers. Lot’s of companies will never disclose this information, though. The point is, you cannot naively assume that the net sales figure is all credit. You need to think about the company’s business model.
Accounts payable turnover is a little more nuanced, and a little more complicated to calculate, because the numerator is credit purchases. This is not something that is typically disclosed by companies, at least not directly. There is no line on the income statement or balance sheet called credit purchases. You therefore need to figure out how much the company bought from its suppliers, and make the assumption that these were all credit sales. This is not always accurate, but as is always the case, we just have to remember to interpret the results of our calculations in light of our assumptions.
Credit purchases starts with the cost of goods sold, and there is another problem right there, because cost of goods sold includes inventory costs that were not transactions with suppliers. For example, the wages of the employees who assembled the inventory are included in the cost of goods sold, but they wouldn't be included in accounts payable. So again, we just need to use this fact when we interpret our calculations. We start with cost of goods sold because it is a first approximation of the credit purchases during the year, on the assumption that the company bought the inventory from its suppliers. We then have to adjust this figure to account for the change in inventory levels over the year. We do this by subtracting opening inventory from this figure, because that was not purchased on credit this year. It was purchased on credit last year, so we exclude it from the calculation. Then we add the ending inventory, because that is inventory the company purchased on credit this year that was not captured in the cost of good sold figure. So, credit purchases is cost of goods sold, minus the inventory that the company already had on hand, plus the inventory that it bought during the year but hasn’t yet sold.
Let’s look at the Saputo calculations. (You might want to try to figure out for yourself how I came up with the credit purchases figure.)
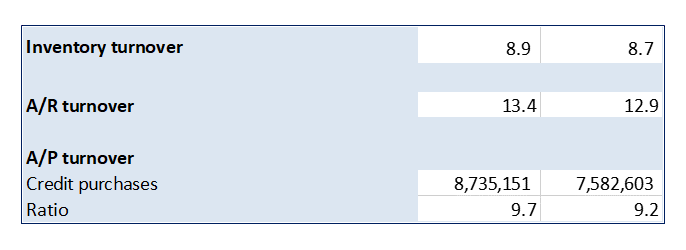
You can see that Saputo’s inventory turnover is fairly stable. It’s gone up slightly, from 8.7 to 8.9. It’s selling through its inventory faster.
A/R turnover is also slightly higher. It's gone out from 12.9 to 13.4, so it's collecting more frequently from its customers.
A/P turnover has also gone up. It's paying off its suppliers more frequently during the year.
Great. But what does this tell us? How can we fit all of these numbers together to create an overall picture of the company’s operating efficiency?
The calculation that does this for us is the cash lag. One of the realities you have to face in business is that after you purchase inventory from your suppliers, you then may have to store it until it sells to a customer. If your sales are business-to-business, you may then have to wait even longer before you get paid by your customers. At some point in time, independent of all this, you're going to have to pay your supplier. If that date arrives before you collect from your customer, you’ve got a cash lag. Cash lags are bad. You want them to be as short as you can feasibly make them.

Let's look at the components of the cash lag calculation. First of all, we have the number of days of inventory that the company has on hand. That can be calculated by dividing the number of days in the year, 365, by the inventory turnover ratio that we calculated above.
Next, we have the average collection period. That’s 365 divided by A/R turnover. This tells us how long, on average, it took to collect from customers.
If you add these two results together, you get the number of days, on average, between buying an inventory item and collecting from the customer you sold it to.
The third component is the average payment period. That’s 365 divided by A/P turnover. This tells you how long, on average, suppliers waited to get paid.
If you subtract this from the previous total, you get the average number of days between paying suppliers and collecting from customers. That’s your cash lag. It’s also referred to as the inventory self-financing period because a company has to have the funds to bridge this gap in cash flows.

If you do these calculations for Saputo, here's what you learn. The number of days inventory on hand and the average collection period each went down by one day. The average payment period went down by two days. Because the average payment period is subtracted from the other two, the net difference is zero. Saputo’s cash lag is unchanged from 2014 to 2015.
When we looked at the turnover calculations earlier, we were uncertain what the overall effect of the changes was. Now we know. By doing the cash lag calculation, we learned that there was no net impact on the cash lag.
However, we also know that everything is happening just a little more rapidly. Each component is down one or two days. This suggests that Saputo’s operations are getting a little tighter, a little better managed, as time goes by. This reflects positively on management, I’d say.
Pulling It All Together
All right, we've done a lot of calculations with Saputo’s 2015 financial statements, and made some provisional interpretation of the results.
What can we do to pull all this together into a persuasive argument about how the company is doing?
We started with the common size analysis, which showed us that Saputo was a very stable company from 2013 to 2015.
The trend analysis showed us that Saputo’s operating income was not growing as fast as its sales, but that this was slightly offset by one-time gains on disposing a business unit and some other restructuring. The decline in operating margin might be a concern over the long run, particularly if it indicates that Saputo is finding it difficult to operate profitably in new markets outside of Quebec.
We learned from looking at the company’s financial position that it is deleveraging, as it pays off some of its debts and increases its equity. That sounds healthy, doesn’t it?
However, a look at its financial performance suggested that its gross margin and profit margin are just a bit tighter than they were a couple of years previously. Its return on assets hadn’t changed, but this meant that its return on equity was down slightly, due to the deleveraging. When we dug into that using the Dupont analysis, we saw some clues in increase in equity, caused by temporary gains on currency translation. That the company is operating on tighter margins, while becoming exposed to more currency risks, raises some mild concerns.
We didn’t dig into Saputo’s cash flow statement as fully as we might have, for reasons of space, but we saw from the cash lag calculation that the company is operating just a little bit more efficiently.
Taking all this together, Saputo looks like a company that is very well run, but that is having to actively manage the risks of expanding into overseas markets. So far, so good, but the company should be watched carefully to see if these risks materialize.
Summary
So, what have we learned about financial statement analysis?
We started by looking at the production of annual reports and the whole idea of impression management. We've talked about the importance of reframing the financial statements numbers to generate new meanings, and using tension to develop critical insights. We also discussed the concept of earnings quality, whether earnings are repeatable or the result of one-time events.
We've looked at all the calculations for common size analysis, trend analysis, and the most important financial ratios, dividing them up into the categories of financial position, financial performance, and cash flows. We learned that the interpretation of these calculations needs to take into account the company’s overall strategy.
It was a long lesson, but that’s unavoidable if you want to understand the topic at more than a superficial level, because financial statement analysis is complicated and nuanced.
Enjoy the tools that you now have at your disposal and try to put them to use someday soon.
Downloads
Thoughts on Saputo’s Current Ratio
Note 9 shows that the company has an unsecured bank credit facility — basically a line of credit — that it used heavily in 2014. The note doesn’t say why it was used that year, but the facts are that (a) they managed to pay off a lot of what they borrowed, and (b) that facility is still there so they could draw on it again at any time.
Note 10 shows that the company’s long term debt is not changing that much. The drop in the current portion of LTD is not because the company is paying back debt, but because some of the debt came due this year and they replaced it with new debt. That new debt doesn’t have to be repaid for a few years, so it disappears from the current portion of LTD, but it’s still LTD. The only good news about this is that the new debt is at a much lower rate of interest than the debt it replaced.
My take-away from this is that the drop in LTD is not an indication that the company is reducing its debt strategically. Between the temporary use of the credit facility last year and the temporary drop in the current portion of LTD, nothing substantive has changed. The company is not facing a liquidity crisis by any means, but its liquidity has not improved as much as the increase in the current ratio might suggest.
Thoughts on the Equity Multiplier
We asked why Saputo’s equity multiplier has gone down over the last three years, taking the ROE with it. It’s mainly because the total equity went up so much in 2015. Equity went up about $800 million. This was due to an increase in earnings of over $600 million, less dividends of almost $200 million. But that leaves almost $400 million of the increase in equity unexplained.
The answer can be found on the statement of comprehensive income. There was a gain on currency exchanges of almost $400 million. Saputo is a multi-national company and it happened to get lucky on currency exchange rates moving in a favourable direction. This is not something that Saputo can control, of course, though management can hedge against it.
Chances are, currency exchange rates will move in the other direction some day, so Saputo has made the wise choice of setting this gain on currency translations aside in a reserve. You can see this in the increase of the “Reserves” line of the equity section of Saputo’s balance sheet. A reserve is just a way of management and the board of directors signalling to shareholders that some of the equity is not available to be paid out as dividends, since it may well be needed in the future if exchanges rates move back to where they used to be.
Title photo: screen capture of one of my financial statement analysis spreadsheets