
In previous articles, I have explained the balance sheet and the income statement, two of the three key financial statements that organizations use to tell their story. This article covers the third one, the cash flow statement.
One Simple Question
The cash flow statement tries to answer one simple question: what caused the amount of cash in the company to change over the past year? If the cash went up, it tells us where the cash came from. If the cash went down, it tells us where it went.
To do this, the cash flow statement turns the balance sheet and income statement inside out. It rearranges every item on those statements in an effort to show us how cash moved into and out of the company. It sorts all these movements of cash three categories: operations, investments, and financing.
Operations
Operating activities are what the company does to earn money. If it is a manufacturing company, this section is about making stuff. The cash outflows might be for purchasing raw materials or paying workers. Cash inflows might be for collecting from customers.
If it is a news media company, this is all about gathering and publishing the news. Its cash outflows might be for buying content from another news source, or paying for a reporter's trip to investigate a story. The cash inflows might be from subscriptions and advertising.
Investments
Investing activities are all about acquiring (and sometimes selling) the long-term assets a company uses in its operating activities. A manufacturer might build a new factory. A news organization might purchase a rival newspaper, or invest in a computer system to manage its news content. Those are all cash outflows. A cash inflow related to investments might be when the news organization sells its old printing press.
However, investing activities aren't only about operational assets. They also can include buying and selling the stocks and bonds of other companies (as opposed to issuing and repurchasing its own stocks or bonds, which is financing). This will be something a company does if it has excess cash. We saw this with Apple.
Financing
Financing activities include selling the company's own shares to investors, and borrowing from creditors. These cash inflows are about raising the money the company needs for its investing activities. For example, the company might issue bonds to obtain money to build a manufacturing plant. Of course, if the company is brand new, a "start-up," it might use the cash it raises from financing to pay for its initial operating activities, until sales start to bring in money.
If the company is well established and profitable, its cash flows related to financing might be outflows rather than inflows, as it pays back its creditors, pays dividends to its investors, or repurchases its own shares from the stock market.
How These Sections Relate to Each Other
A really good way of looking at the cash flow statement is simply to see which sections are contributing cash and which ones are using up cash. (I learned this from an old article in an accounting journal. The reference is provided at the bottom of this article.)
If a company is generating cash from financing and using cash for investments, this would make a lot of sense for a start-up or for a company that is planning to expand. It wouldn't make sense for a company in a declining industry.
If a company is generating cash from operations and using up cash in its financing activities, it's probably a stable, profitable company that is repaying debt or paying good dividends. But if the cash for loan repayments is coming from the sale of the company's assets, that could indicate trouble.
The point is simply to compare the subtotals for each section and ask yourself whether they make sense, given what you know about the company.
An Example
Let's look at a cash flow statement in more detail. The example I'll use is Saputo, a Quebec-based dairy company, the tenth largest in the world according to its website. Saputo is both a producer and a distributor. Its inventory consists of things like milk and cheese. Its customers are grocery stores that sell to consumers.
The place to start reading this is not actually on the cash flow statement itself, but on the balance sheet. The first line of the balance sheet tells us how much cash the company has on hand at the year-end, and how much it had on hand at the end of the previous year. It is the difference between the two numbers that the cash flow statement is supposed to explain.
In Saputo's case, here is the cash on hand at the end of 2015 and 2014, as shown on their 2015 balance sheet:
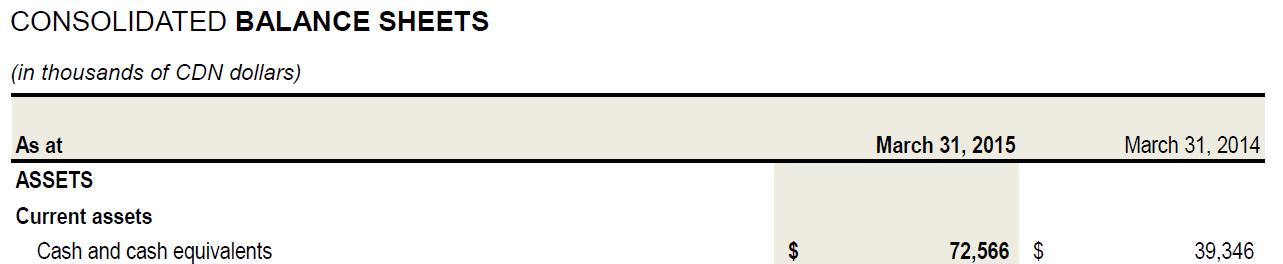
What the cash flow statement needs to explain, then, is how Saputo's cash balance grew from $39 million to almost $73 million. This is an increase of $33,220,000.
Here is Saputo's 2015 cash flow statement in its entirety. I'll be concentrating on the 2015 column. I will break it down section by section, beginning with the summary in the very last section and then returning to the top to explore each section in detail.
As I indicated, we will start with the bottom section of this statement, focusing on the 2015 column:

This set of four lines tells the overall story. It says that the company produced a net increase in cash of $30,487,000 during the year. It also benefited from a smaller increase in cash, to the tune of $2,733,000, just because of fluctuations in currency exchange rates. If you add these two amounts together, you get $32,220,000, which is the increase in cash that we want to see explained.
This increase, added to the $39,346,000 of cash that Saputo had on hand at the beginning of the year, gave the company $72,566,000 in cash at the end of the year. You will recognize these as the two figures we saw on the balance sheet.
Since we know that part of the increase was due to currency fluctuations, everything above this section of the cash flow statement can concentrate on explaining the remaining $30,487,000 increase in cash.
Just one thing, before we go any further: It is quite common for cash flow statements to show the "Cash and cash equivalents, beginning of year" line at the very top of the page, then show the operating, investing and financing sections, followed by the "Cash and cash equivalents, end of year" line. Both approaches are acceptable.
Explaining the change in cash
Looking at the main body of Saputo's cash flow statement from a high level, you can see that its operating activities generated over $769 million in cash, its investing activities used up over $166 million (the parentheses around this figure indicate that it is a negative number, so a net use of cash rather than a net source of cash), and the financing activities used up over $572 million in cash (again, a negative number).
Saputo's Operating Activities
The operating activities section is the most complicated one, so let's not put off explaining it any longer. This section is organized in what is called the indirect method. It could have been organized by listing all the operating cash flows directly, such as how much was paid for raw materials or wages, and how much was received for sales. Many companies prefer the indirect method, however, because it links the explanation right back to the income statement. Since many readers pay great attention to the income statement, using it as a starting point makes a lot of sense.
Here is the operating activities section, close up:

It begins with the net earnings from the income statement. "Net earnings" is an economic measure, not a cash measure. It is the result of using accrual accounting to show all the revenues that were earned by Saputo in 2015, rather than the amount of cash customers paid Saputo during the year. For instance, some of the payments Saputo received from customers at the beginning of the year were probably for sales made towards the end of 2014, because business customers buy on credit and pay their suppliers later, usually within month or two of the purchase.
On the other hand, payment for some of Saputo's sales towards the end of 2015 wouldn't have been collected yet by the end of the fiscal year. They are shown as part of net earnings, but are not part of the cash flows received from customers.
What a company records as sales is therefore always slightly out of sync with the payments it receives from customers.
Similarly, some of the expenses related to the 2015 sales may have actually been paid by Saputo in 2014 or 2016. This can be simple timing differences, such as when the electricity bill for the last month of the year arrives in the first month of the next year and is paid in the second. But it also has to do with how companies match expenses to sales. When Saputo buys raw materials from a supplier, it records this as a purchase of inventory (that is, as an asset rather than as an expense). The cost of this purchase doesn't show up as an expense until the inventory is sold to a customer: DR Cost of sales, CR Inventory, for you bookkeeping geeks.
Still, the net earnings figure is loosely related to the net cash generated by operating activities, so it's a fine place to start. You just have to adjust the net earnings to "undo" all these effects of accrual accounting, in order to calculate the net cash from operations.
There are three places in Saputo's operating cash flows section where these adjustments are made. The first is the list of "Adjustments for" various things, shown right under the net earnings number. This list includes all the expenses on the income statement that did not involve cash. For instance, "Depreciation and amortization" is an expense recognized in 2015 for the wear and tear on Saputo's long-term assets. These assets might include dairy equipment bought by Saputo years ago. Such equipment lasts for years, so instead of showing the purchase as a huge expense in the year Saputo bought it, the cost of the equipment is measured out onto the income statement a little bit each year, as a depreciation expense. This is a way of acknowledging that the equipment is wearing out and growing obsolete.
Where the operating inflows happen at the RC Harris Water Treatment Plant.
I would explain the rest of this list of adjustments, but it gets pretty technical in a hurry and that would distract us from understanding the cash flow statement. Suffice to say, everything on this list relates to items recorded as expenses on the income statement for which Saputo didn't actually pay any cash this year, and as revenues (gains) on the income statement for which Saputo didn't actually receive any cash this year. The cash part of these transactions happened in other years, and they were only shown on this year's income statement because Saputo thought this was the best year to tell people about them. Saputo's auditor would have been fully aware of these decisions, and would have agreed with them as an appropriate way to describe the profitability of the company.
The second place in the operating cash flows section where an adjustment to net earnings is made is on the line that says "Changes in non-cash working capital items." This has to do with changes in current assets or current liabilities on the balance sheet. If inventory went up from 2014 to 2015, then Saputo must have used up some cash to buy that inventory. If accounts receivable went down from 2014 to 2015, then Saputo must have collected some cash from its customers. Similarly, if accounts payable went down, Saputo must have paid some cash to its suppliers. Taking all these kinds of changes into account, Saputo used up a net amount of $14,449,000 in cash.
Saputo shows a subtotal at this point, "Cash generated from operating activities." This brings us to the third place where adjustments are made to net earnings. The amount of cash paid for interest and income taxes during the year is deducted from the subtotal. You will notice that these don't quite match the related adjustments for these expenses that were made in the list of "Adjustments for" above. What Saputo is doing is providing a very good level of detail about the difference between its interest expense and its interest paid, and between its income tax expense and income tax paid. The expenses are the accrual accounting amounts recognized this year, and the amounts paid are the actual cash that Saputo parted with related to these expenses. (In Saputo's case, the amounts are pretty close. We'll see in an upcoming article that the expense and the amount of cash paid can, in some circumstances, be very different.)
All of this means that Saputo generated $769,815,00 in cash from its operations. The overall change in cash for the year was only about $30 million, however, so we need to see where the bulk of this cash from operating activities went.
Where it went was into investing and financing activities. These sections are quite straightforward compared to the operating activities section.
Saputo's Investing Activities
The investing activities section has only five items, plus a total:

Keep in mind that positive numbers in the cash flow statement mean cash coming in. Negative numbers, shown in parentheses, mean cash going out.
This means that Saputo spent almost $65 million acquiring another business, perhaps a supplier or a small competitor. It spent almost $187 million on additions to its own capital assets, perhaps dairy equipment or a new factory of some sort. It brought in $114 million in cash by selling a subsidiary, and another $2 million by selling some equipment. The rest, $30.9 million, is just "Other." Your guess is as good as mine.
So, of the almost $770 million in cash generated by operating activities, a net amount of $166 million was used for investments in subsidiaries, factories, and equipment. That still leaves an awful lot of cash, so where did it go?
Saputo's Financing Activities
It went towards financing activities, of course. That's the only section of the cash flow statement left. So let's look at it:

This shows that Saputo used $150 million in cash to pay down its bank loans. It had other long-term debts besides bank loans, however. These might have been bonds. If we looked closely at the notes to the financial statements, we'd find out, but it doesn't matter, let's just call it long-term debt like Saputo does. The second and third lines here show that Saputo issued $410 million in long-term debt and paid off $640 million.
It is quite normal for some long-term debt to come due in any given year, and for a company to replace it with new long-term debt. This is just like when your home mortgage comes up for renewal. It's quite routine. What's not routine is that Saputo didn't renew all of its debt. It used quite a bit of cash to pay off debt without renewing it ($640 million minus $410 million = $230 million in cash to pay down long-term debt). This is a significant use of its cash, and indicates that Saputo doesn't need that debt anymore and is happy to get rid of it. (An alternative explanation would be that a major creditor called its loan, but that usually only happens when a borrowing company runs into financial trouble, That's clearly not the case with Saputo.)
The next two lines have to do with shares. Saputo issued $54 million in new shares and purchased almost $49 million of existing shares from shareholders. Since these amounts are small compared to the debt figures, we can probably assume that these transactions had to do with executive compensation, rather than any strategic decision to raise or retire significant amounts of share capital.
The final item is the amount paid to shareholders as dividends, almost $198 million. This is a pretty healthy amount of cash for a company of Saputo's size.
Interpreting Saputo's Cash Flow Statement
There is only one possible conclusion to come to when interpreting this cash flows statement: Saputo is very, very healthy.* It generated a large amount of cash from operations, it used a reasonable proportion of this to invest in a new subsidiary and some capital assets, and used a very large proportion of it to pay down debt and pay dividends to shareholders. And yet, when all was said and done, its cash still went up by over $30 million.
This is a great example of a healthy cash flow statement. It matches the theoretical aspirations that accounting regulators have for cash flows statements. In an upcoming article, though, I'm going to delve into a cash flow statement that has all the warts and blemishes of the stark reality of accounting practice. Stay tuned!
* I know there are reasons for Saputo’s success that don’t sit well with everyone. For instance, one of its strategies appears to be buying up smaller competitors and closing their production facilities. This reduces competition in the dairy market. It has also led to a loss of jobs in places like Sydney, Nova Scotia, where jobs are hard to come by. It’s these effects of capitalism, where shareholders are presumed to bear the financial risk despite the obvious fact that much of the financial risk is borne by workers, that motivate me to look closely at corporate financial statements.
All financial information about Saputo is taken from its 2015 annual report. Yeah, I know they've released a more recent one. You can write about it on your blog.
The accounting journal article I referred to is:
Dugan, Gup & Samson (1991). Teaching the Statement of Cash Flows, Journal of Accounting Education, Vol. 9, pp. 33-52, 19
Photos of RC Harris Water Treatment Plant in Toronto, taken in 2012. The RC Harris is an art deco masterpiece. It handles flows of water into Toronto's drinking water system, filtering water from Lake Ontario so pure they don't even have to add chlorine. But they do anyway, for liability's sake. The construction of the plant was featured in one of my favourite novels, Michael Ondaatje's remarkable In the Skin of a Lion. These pictures don't begin to do the building justice. It is a monument to how beautiful public buildings can be, if we put the effort into them.