
Welcome to Critical Accounting, a full university-level course that will teach you everything you need to know about financial accounting and financial statement analysis. This course is unique because it not only teaches you the basics of accounting, it teaches you to think critically about accounting.
Throughout this course, I'll be teaching you a challenging way of looking at accounting. Accounting is not just about reporting the financial performance of an organization. It actually shapes the entire world that we live in. Accounting is behind every product, every service, every government policy, and every story of the rich and poor.
Accounting is a tool of persuasion. If you want to understand how corporations use accounting to convince you to see them in a particular light, this course is for you.
Now, on to the first lesson!
Apple’s Surprise
We're going to start by looking at Apple. It's a company you're no doubt familiar with, which is a good place to start. You want to have some familiarity with what a company does if you want to understand its financial statements, and just about everybody gets what Apple does.
So here’s a question for you. What did Apple do in 2016 that it had not done for 15 years?
The answer is that its sales dropped from the previous year.

As you can see from this graph, Apple's revenue from 2001 onwards grew dramatically during the first 15 years of this century. And then in 2016, unexpectedly, the sales dropped. So we're going to look at Apple's 2015 financial statements to see if there are any clues as to why this might have happened.
Here's how we're going to approach this:
We're going to look at Apple's income statement, balance sheet, and cash flow statement, to get a general overview of what those statements are about.
We’ll learn at a basic level how to read these statements, what you can expect to find on them, how to understand the information they contain, and also how they're connected to each other.
We’ll develop some provisional questions about what went on at Apple during this time period, to help you learn to think critically about what these financial statements say.
Apple’s Revenue Sources
So if you want to understand why Apple's revenues dropped in 2016, is probably helpful to stop and think a second about what it is they actually sell. What's your favorite Apple product? If you answered iPhone, you are amongst a large, large group of people because Apple's revenues are dominated by iPhone sales: two thirds of the revenue in 2015, and that has not changed very much in the last few years.
The following figures are pulled from the Apple annual report. However, you won't find this breakdown of the sales by product category in the financial statements themselves. You have to go looking in the notes to the financial statements, and that's one of the things that's going to be a feature of this course: digging into the notes to look for more detail.

As you can see, Apple's iPhone sales are dominant, at 66%. They have three sales categories at about 10% each: Mac, which is all their computers; iPads, which is all of their tablets; and then their services at about 9%. Everything else is minuscule. So the large majority of their sales comes from the iPhone.
One have a bit of a concern here that perhaps they are a one product company, and to a certain extent, I think that's a fair criticism. Apple has been known as a computer company in the past, but it's really a cell phone company now.
One of the other concerns is that the iPhone was launched back in 2007. So in 2015 the product was already eight years old, and it's several years older now. The other big hitter for them is the iPad, and it was launched in 2010. Think about it. These two big products that people associate with the innovation and the product styling of Apple are actually quite old. And of course, the original Macintosh computer was launched way back to 1979, and the iMac in 1998. All of these products are fairly long in the tooth, and that might be a bit of a concern for Apple aficionados because it indicates that all of their revenue depends on fairly old products.
Let’s look now at the income statement and see what we can find out about Apple's profitability and where it's revenue might be coming from.
Income Statement
Here we have the income statement for Apple for 2015. And the very first thing that you'll notice is that the statement is called the Statement of Operations. It's not called the Income Statement at all.

There are many synonyms for this particular kind of statement: the income statement, the statement of operations, the profit and loss, or P&L. All of these mean the same thing.
You notice that word “consolidated” up at the top. That simply means that Apple is a large company with a whole bunch of subsidiaries, one for every country in which it operates more than one. In fact, in any country, you'll have a subsidiary for intellectual property, for product development, for warehousing, for sales, and so forth. And all of these companies from around the world that all belong to Apple are consolidated together, added together to produce the statement we’re looking at.
The columns are labeled by the date of Apple’s fiscal year end. By convention, companies tend to have their fiscal year end at the end of one the quarters of the year, that is, at the end of March, June, September, or December. Every company gets to choose for itself, but once a company has chosen a year end, it doesn’t change. Apple happens to have a September year end.
But notice that the date for Apple isn’t exactly September 30th. It’s close to the end of September, but you can see that the actual date varies from the 26th to the 28th. It so happens that those were all Saturdays. Retail companies like Apple tend to have one day of the week where sales are noticeably higher. In the USA, that’s typically Saturday. To make the fiscal years comparable, these companies can choose to end each fiscal year so that each year includes the same number of those high-sales days. Apple does this by beginning each fiscal year on the last Sunday of September. This puts the year end on the preceding day, Saturday.
So that explains the dates.
You’ll notice that all of these numbers are in millions. It says so just under the title of the statement. The very first figure that you see, therefore, $233,715, is actually $233,715,000,000. All of Apple’s financial numbers are in millions throughout its statements. A smaller company might choose to present its numbers in thousands. Important to know.
Apple’s income statement is organized as follows. It starts out with net sales, the subtracts the cost of sales to give you the gross margin. That's the very first calculation that you're given by Apple. The word "net" in net sales simply means all of the sales during the year, minus any returns. If a retail customer or a business customer returns a product to Apple, that would be deducted from the overall sales to give the net sales.
The cost of sales includes all of the parts that go into the products – the processor and the glasss screen for the iPhone, for instance -- plus all the labor to assemble them together. And more than that, cost of sales also includes the cost of the packaging and the cost of shipping product from the supplier to Apple’s warehouse of the company and then on to the retail store. All of those things would be the cost of putting the product in front of the consumer and making it ready to purchase.
So what does this give you then? It gives you, out of the $233 billion worth of net sales, a gross margin of $93 billion left over for running the company.
So what did it cost to operate Apple as a company? The total operating expenses are $22 billion. So $93 million minus $22 million giving you an operating income of $71 billion.
What's curious about this operating section is the breakdown that Apple provides. It only separates its operating expenses into two categories. Research and development is the one it wants to highlight. Everything else is other. "Selling general and administrative" is just a complicated way of saying other.
The research and development expense is highlighted here, I think, because Apple wants you to pay attention to just how much it spends on R&D. This amount has almost doubled in the last two years, and Apple presumably believes that this is something worth highlighting, to reinforce its image as a technology-intensive company, one that prides itself on innovation.
The next section is Other income or expenses. What do we need to know about this? Well, first of all, we know that these amounts are not related to operating the company because they come after operating expenses. They had to do with other, non-operational aspects of the overall legal entity of Apple, but had little to do with the company you think of when you hold an Apple product in your hand. Other income and expenses might include gains and sales on investments in the stock market, for instance.
One of the things that is worth looking at here is the word expense that’s in parentheses. So if you look at the numbers to the right of “Other income/(expense), net”, none of them are in parentheses. This means that they are all positive numbers, or income. If you add together all of the other income and deduct all of the other expenses that happened at Apple outside of its operations, they netted out to positive numbers, or income, in these years. So if you saw a number on this line in parentheses, that would indicate that the net number for that year was negative, or an expense. However, in each of these years shown here, thankfully for Apple, its other expenses came to less than its other income, so Apple ended up with a positive number here each year.
The final section of this statement is the provision for income taxes. This word "provision" is quite important. This is not the amount of income tax that Apple paid to the government. It's merely the amount that it's set aside in its accounting books as the portion of its overall income tax that matches the sales that occurred in these years. Apple will part with cash for those income taxes only when the payments actually come due. So that's why the word provision is there. It's simply saying that this is the economic significance of the income tax, regardless of the fact that the tax payment may be remitted to the government in some other year. This is all to do with accrual accounting, which we’ll discuss in more detail in another lesson.
So, stepping back then for a second and looking at the overall picture here, the comparison of the three years gives us an understanding of what's happening at Apple in terms of the profitability of its operations. We can see that there's been a tremendous increase in 2015 in its net income, jumping from $37 billion and $39 billion in the first two years up to $53 billion in 2015. This would indicate, you'd think, that the future was very sunny for Apple, making the conundrum of its drop in sales in 2016 even more interesting.
So we have an increase in net income. What we want to do, if we're going to think critically and analytically about these financial statements, is to try and figure out the factors that are driving this increase.
Obviously the place to start is the net sales, and you can see that there was a large increase in net sales from 2014 to 2015, matching the growth in net income. Clearly, Apple is making more net income because it's selling more product. But what is going on behind these numbers? Let's look a little deeper.

The leftmost table here, Sales by Region, comes from the notes to the financial statements that you'll learn to dig through in this course. Apple breaks down its overall revenue figure by the regions where those sales occurred. You can see that the figures at the bottom of this table exactly match the figures from the top line of Apple’s income statement.
The two tables to the right of that, the Common Size and the Trend tables, are calculations that I've done with those numbers. One of the things I want you to learn to do in this course is to take the numbers from the financial statements and use them yourself to recontextualize them, to compare them against each other. The easiest way to do that is to key the numbers into a spreadsheet and start doing calculations with them. That's what I've done here.
I've got two sets of calculations. The common size calculation is a vertical comparison. It compares the $93 billion figure at the top of the 2015 column to the total at the bottom: $93,864 divided by $233,715 is 40%. Then it compares the $50,337 to the same total at the bottom, $233,715, giving 22%, and so on. In each column, it calculates what percentage each number is compared to the total at the bottom of the column.
Trend analysis is a little bit different. It does a horizontal comparison, often called a horizontal analysis. It takes each number and compares it to the earliest figure in the same row. So you're taking $93,864 divided by $77,093, giving a ratio of 1.22. Then you're taking $80,095 divided by $77,093, giving 1.04, and then you're taking $77,093 divided by itself to give you 1.00. Every row is calculated the same way.
So what do we learn from these calculations? The overall picture for Apple is that it grew by a factor of 1.37, or 37% in other words, over two years. Keep in mind this is not a comparison of one year to the previous year, it’s a comparison of each year to the earliest year. So that's a 37% growth in the company’s net sales over two years.
What was really driving this, if you look carefully, is the one line that stands out above all the others. That’s China. China grew by a factor of 2.17. So more than double the sales in two years. Compared to Apple’s overall growth of 37%, this doubling of sales in China indicates the growing importance of China to Apple’s future success.
We can also see this revealed in the common size analysis. China grew from 16% of total sales in 2013 to being a quarter of the overall sales in 2015. Again, this indicates to us that growth in China was very, very important to Apple from 2013 to 2015. But it also raises the question of whether this growth will continue. It would clearly be a very, very important part of Apple’s 2016 strategy to continue to expand into China.
There's another curious thing about this table that I just want to raise as a question off to the side: what happened to India? And Africa? And Russia? You’d think that those would all be fairly significant sales regions for Apple. Yet they don't show up in this table at all. Russia, I presume, is perhaps lumped into Europe.That makes a certain amount of sense. But where is India? Is that included in Asia Pacific? I don't think of India as being part of the Asia Pacific. And for goodness sake, where is Africa? It doesn't show up in this chart at all.
Setting all that aside, what have we learned? We've learned that net income is rising mainly because sales in China are rising.
Now, is there anything else driving the increase in net income? Let's look at the cost of sales next.

This is the statement of operations, again. I've keyed it into a spreadsheet so I can do a little bit of playing with it, and I've produced a common size analysis.
What do we see here in terms of the cost of sales? Obviously the cost of sales in raw terms has grown dramatically from $106 billion to $140 billion. But one of the things the common size analysis tells us is that, in relation to net sales, the cost of sales has actually dropped. That is going to improve the net income for the company.
So net income is rising, not just because the sales are growing, but because the cost of sales is declining in relative terms. Why is it declining? Let's have a closer look.
Let's just stop and think again about what it is that Apple sells. How many Apple products and services can you list?
Here's the list that I got from Apple’s 2015 annual report. The products include the iPhone, iPad, computers, Apple TV, Apple Watch, Beats headphones, iPod, and all their accessories. And then there’s all the services, which includes iTunes or what's called Apple Music now, the app store, iBooks, Apple Care, which is their maintenance plan, warranty service, Apple Pay for processing transactions like a credit card, and of course all of their licensing. Apple licenses its products or logos to other companies, charging a fee for that. So this gives us an idea of just how complex Apple’s revenue mix is.
What's included in the cost of sales? In general, for any company’s products, you're going to have all of the parts, of course, and the labor that it takes to put the parts together, plus packaging and storage and so on. I mentioned this earlier.
Services also have a cost of sales. It would include the wages earned by the people who, for instance, run the servers and webpages that Apple relies on for its commerce. There are tremendous costs involved in creating and running Apple’s websites. So all of the wages and all the information technology that are necessary for those websites would be included in the cost of those sales. If you're talking about the Apple Care program, Apple would have to pay actuaries and lawyers to price out the warranty and draw up all the necessary customer contracts. All of that is going to add to the cost of these services.
So the question then is, what changes has Apple made over the past three years, from 2013 to 2015, that would have reduced the cost of sales?
If you think about what was happening at that time, you'll come up with a bunch of possible answers. There might have been engineering improvements, to make it more efficient to build and assemble the products.
Or the cost might have gone down due to Apple’s power over its suppliers. One of the things you need to recognize is that accounting is about power. It is about the ability to dictate terms to other entities. It is about the ability to control the story that you're telling about the company.
So in this case, having power over the suppliers and being able to force them to produce subassemblies and so forth at a lower cost, would give Apple the ability to squeeze down the overall cost of sales.
A drop in the cost of sales might also come from selling cheaper products. The iPhone 5C was coming out at this time. That was the color version of the iPhone. Now, I spent some time in my youth working in a Radio Shack store in Moose Jaw, Saskatchewan, and one of the most popular products that year was a plastic transistor radio that came in bright colors, blues and pinks and oranges. It was extremely cheap and extremely popular. I think when a company like Apple starts producing its products in a variety of different colors, instead of coming up with new technical innovations, it makes me wonder whether they're actually getting as much out of their R&D as they could. But that's just me.
Finally, you might also get a change in the cost of sales by simply having a different mix of products. If none of your costs have changed during the year, but you start selling more of the product that has the highest margin and less of the products that are relatively costly for you to make, then you would certainly reduce the cost of sales in relative terms.
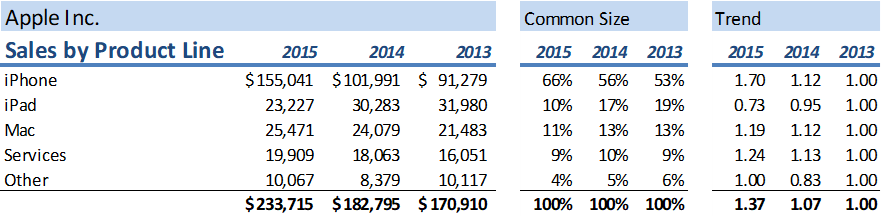
If we can look at Apple’s sales by product line, we can see if that might be driving some of the change in the net income numbers for Apple. Again, from the notes to the financial statements, I’ve taken the sales broken down by product line. The previous table that we looked at had sales broken down by geographical region. This is by product category. You can see separate lines for iPhone, iPad, Mac, services, and other. (Earlier, when we learned that the iPhone made up 66% of Apple’s sales, this is exactly the table that I was quoting.)
All right, so what can we learn here from this table? As before, I've done a common size and a trend analysis to try to generate some insights. The question to ask here is, which Apple product out of all of them attracts the premium pricing? Clearly that's the iPhone. It's not only Apple’s biggest seller, but it’s the one that is most profitable. Apple charges a premium for its phones compared to the price you might pay for a similar model from Google. The sales for Apple, as we know, went up by 37% over the two year period, but our calculations show that the sales of the iPhone grew by 70%.
So, if your product sales are becoming more and more focused on your most profitable product, then of course your overall cost of sales is going to drop in relative terms. That, then, is partly what's driving the drop in Apple’s cost of sales. Basically put, when iPhone sales rise fastest, the gross margin also rises because iPhone is one of those Apple products that attracts premium pricing.
Balance Sheet
Let's look now at the balance sheet. We've looked at the statement of operations, which gives you the picture of what happened during the year. The balance sheet is going to give us the picture of what it looks like at the end of the year. It's like a snapshot as opposed to a movie.
Here is the consolidated balance sheet for Apple for 2015:

You notice it only has two columns of numbers, comparing 2015 and 2014. The statement of operations had three. This is standard for many companies. Accounting regulators determine the minimum amount of information they must provide, and in this case, regulators in the USA decided on two years for the balance sheet. Apple only provides what it has to.
So what does Apple’s balance sheet look like? We see two sections: the assets, and the liabilities and shareholders’ equity. These two sections have the same total. They balance, hence the name “balance sheet.”
The asset section is everything that the company owns, and the liabilities and shareholders’ equity is everything the company owes. That is, a company doesn’t just owe its creditors the amounts listed as liabilities. It also owes the equity to the shareholders.
The shareholders are external parties. They are not the company. What are they? It would be stretching things to refer to the shareholders as the “owners” of the company. In practical terms, there's no such thing as an owner of a large multinational corporation like this. You have people who work for the company and run the company and make all the decisions, and you have a very scattered group of individuals and institutional investors who own the shares. But owning the shares in a company is not quite the same thing as owning a company. All you own as a shareholder is a legal claim on the company’s equity.
If you have a small privately held corporation where one person owns all the shares, then I think it's probably fair to say that they own the company. But there's no person you can point to and say, "You're the owner of Apple." What you are, if you're an Apple shareholder – as I was for about a year or so; I owned I think maybe a fraction of an Apple share; they were extraordinarily expensive – the most you could say is that you own a share of the equity. You can't say that you own Apple. And if you don't believe that, go buy yourself an Apple share and then walk into the office in Cupertino and demand to see the boss. You will get shown the door, not the boss, because you're not the owner, you're simply a shareholder.
So this comparison of these two categories, then – everything that the company owns and everything that the company owes – is the basic thing that holds the balance sheet together. These numbers have to add up to the same total. Everything that the company owns had to come from somewhere, from somebody. Some of it, the liabilities, came from wealth borrowed from other people, and some of it, the equity, came from wealth that's been either invested by the shareholders (“share capital”) or generated by the company (“retained earnings”). That equity doesn’t belong to the company, it actually belongs to the shareholders. This doesn't mean that the company has to give the equity to the shareholders, though. Anything that a company borrows from creditors, the liabilities, must be paid back to its creditors at a certain time. There'll be a contract for the bank loan or a contract with a supplier that says they must be paid back at a certain date. But equity, although it’s owed to the shareholders in a legal sense, doesn’t actually have to be paid to the shareholders unless the company winds up. Until then, the company can hold onto the equity and use it to run the company. And that's the big difference between liabilities and shareholders’ equity.
So these two numbers, assets on the one hand and liabilities plus equity on the other, are always going to be in balance, just by definition. For Apple, the assets come to just over $290 billion and the liabilities come to exactly the same figure.
Liabilities and Shareholders’ Equity
If you look closely at the liabilities and shareholders’ equity section, you'll see that it's broken down into three distinct categories. You've got the liabilities, you've got the share capital (called “common stock” on Apple’s balance sheet), and you’ve got the retained earnings. The liabilities section is subdivided into current and non-current liabilities, but that’s just a distinction by the date they are due to be paid. It’s not a fundamental distinction. Share capital is basically the value received by the company from all the times it has ever issued shares, minus the value it parted with if it ever repurchased shares. (Apple has, many times.) Retained earnings is all the wealth generated by the company since it started, minus any dividends paid out to shareholders over the years.
Apple was founded in 1976. All of the earnings since the company began, minus any dividends it has paid out, are accumulated in that little section there that says retained earnings.
The other line, accumulated comprehensive income, is a bit of an accounting technicality. It will be explained in more detail later in this course. You can ignore it for now.
Look at the share capital figure for a moment, the $27 billion worth of common shares. That is the value the shares had at the time Apple issued them to shareholders. Those shares are worth a lot more now on the stock market. Apple as a company is valued on the stock market at far, far more than $27 billion. It became the first trillion dollar company in 2018.
The value of all Apple’s shares on the stock market is an enormous figure. But when those shares go up on the stock market, Apple doesn't participate in that increase in wealth. That belongs to the people who own the shares: the shareholders.
That's the shareholders who are benefiting from that. So that figure simply represents the amount of money that Apple got when it sold the shares. So then the question we've got is, if this was all the money that it borrowed and generated from selling shares and from retained earnings and operations over the years, what have they done with all that money?
And that's what we're going to look at next. We're going to look at the assets and how they're divided up by Apple.
Assets
So this is a closer look at Apple's assets. You'll see that we have two different sections. You have the current assets and you've got the non-current assets, a binary distinction between them. Very simple. This is just an accounting definition.
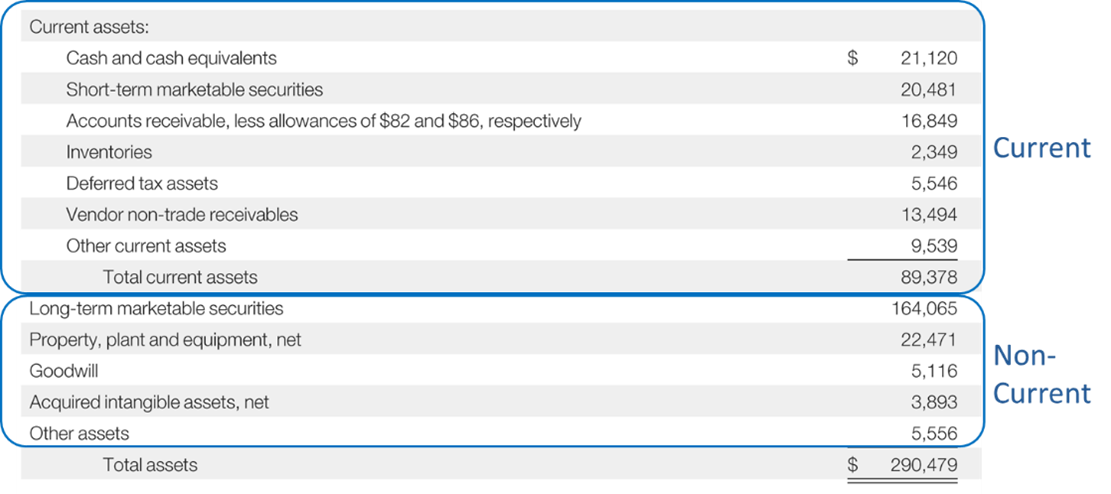
Current assets are those assets that are either cash now or they're expected to be converted into cash during the coming fiscal year. So at the end of 2015, Apple had $89 billion worth of assets that were either already cash or would probably be converted into cash during the year.
So for example, the $2 billion worth of inventories. You would not expect Apple to have the same product sitting on its shelves at the end of next year, as it's got sitting on the shelves at the end of 2015. It will still have some inventory, but they will be new pieces of inventory. The ones that are sitting on the shelves at the end of 2015 would've been sold and converted into cash.
The non-current assets are all of those assets that the company has that are not expected to be converted into cash during the year. It's quite possible that Apple has a factory or a truck or a photocopy that it’s going to sell during the year, but it’s not expecting at the beginning of the year to be converting all of those things into cash. So that's why they're called non-current assets.
I've got a kind of loose definition that I play with when I'm talking about a company like Apple that has a lot of assets: “unproductive assets.” And this is not a technical term. I just mean, are there any assets that are unproductive? Are they just sitting around doing nothing? Or are they perhaps assets that are just low-yield financial securities that are not really producing a lot of profit for the company?
Inventory is a productive asset. It's what Apple sells. You want Apple to have inventory.
Property, plant and equipment. That's a productive asset because Apple needs those facilities in order to produce the products and services that it sells. So all these things – inventory, and property, plant and equipment – they're part of Apple being Apple.
What about all those other assets, though, that are sitting there while Apple decides what to do next? Cash and cash equivalents, for instance. Now, every company needs a certain amount of cash lying around in order to conduct business. You can't be down to zero. But Apple has $21 billion of cash and cash equivalents. That is money that is not invested in inventory. It's not invested in product development. It's not invested in property, plant and equipment. So, by my loose definition, I am going to call that an unproductive asset.
Short-term marketable securities. What is a marketable security? It is a bond or a share issued by other companies. Apple has a bunch of investments in the stock and bond markets that it is expecting to cash in during the coming year. That's why they are called short term marketable securities, and why they are classified as current assets. Any bonds or stocks that Apple owns that it plans to sell in the coming year would be included in this category. So that's another $20 billion of “unproductive assets” right there.
And then you have long-term marketable securities. That's the same kind of thing, but these are the securities, the shares and bonds, that Apple expects to hold onto for at least 12 months.
The cash and the short-term and long-term marketable securities are all relatively unproductive assets for Apple. They total $205 billion.

Now keep in mind, Apple's total assets are only, well, “only” $290 billion. So $205 billion out of the $290 billion worth of Apple's assets are just sitting in the cash drawer, sitting in the bank, or invested in the financial markets, rather than being invested in Apple’s own capacity to produce products and services. That is 71% of its assets. More than two thirds of Apple's assets are not invested in Apple being Apple. I think that's kind of problematic for a company that prides itself on being innovative.
If Apple had any great ideas, why isn't it investing that money in those great ideas? I am not alone in asking this question. A lot of shareholders in recent years have complained that Apple is not doing anything with the excess money it has. It's just sitting on it.
So, what've we learned? That less than one third of Apple's assets are invested in actually being Apple, the technology giant.
Apple’s Debt is Growing
It’s curious, though, that despite all its cash and marketable securities, Apple is going deeper and deeper into debt. As you can see from the figure below, the liability section is organized much like the asset section. You've got a current section and a non-current section.

But look at the long-term debt. The debt seems to have arisen during 2014 because the current portion that year was zero. (The “current portion” is just the part of the long-term debt that is due to be paid back within the next year. If that was zero, it would mean that the borrowing had just begun.) Apple thus started borrowing in 2014, to the tune of almost $29 billion, and by 2015 it had almost $56 billion in debt.
So the long term debt is climbing. The question is why? And in particular, why does Apple borrow money if it has so much cash and all its stock market investments lying around? Borrowing more money makes no sense.
Let's look at the cash flow statement and see if we can figure out some more clues to this puzzle.
Cash Flow Statement
The cash flow statement is a statement unlike the other two. The balance sheet and the income statement both represent the economic value of what's happening in the company, irrespective of when any cash changes hands. The cash flow statement, in contrast, is purely focused on the cash coming into or leaving the company. In other words, it looks at the company through a different lens.
Like the income statement, though, the cash flow statement represents what happened over a 12 month period. In contrast, the balance sheet is like a snapshot taken at the end of the fiscal year.
How is the cash flow statement organized? Well, it starts with the cash at the beginning of the year, and it ends with the cash at the end of the year. Everything in between explains the change in cash from the beginning to the end of the year:

So if you look at the cash at the end of 2013, you'll see that it's the same as the figure at the beginning of the next year, $14,259 million. And then the figure at the end of that year is the same as the figure at the beginning of the next, $13,844 million. So there's continuity from one year to the next.
Looking at the change in cash during the year, you'll see the statement is divided in three sections: operating activities, investing activities, and financing activities. This is how all companies organize their cash flow statements, dividing up the changes in cash into these three categories.
During this course, you’ll learn to look at different transactions that take place and be able to categorize them for yourself. Is this an operating cash flow? Is that an investing cash flow or a financing cash flow? So, what do these categories mean?
Operating cash flows are all of the cash that's generated or used up in the actual operations of the company. Investing cash flows are the investments that the company makes. Remember, this is from the point of view of the company. So when the company takes its cash and invests in a new asset, or it sells that asset and gets some cash back, that is an investing activity. It's not about the investors who've bought shares in the company, despite the similarity of the term. From the company's perspective, those investors represent a financing activity. How did the company finance its own investments and its operations? Financing is all to do with borrowing money or selling shares, to raise money for investing in assets and operating the company.
Obviously, the total of the operating, investing and financing cash flows gives you overall change in cash during the year.
Patterns of Cash Flow Activities
This is a good point to stop and think about the relationship between these three categories. You’d expect companies at different stages of their development to have a different relationship between the operating, investing and financing cash flows.
When a company starts out a startup company, you're going to expect positive cash flows from financing because it's selling shares and generating money to start up the company. It's probably using cash in the investing and operating sections, so you'd have negative numbers there.
As the company matures and starts selling its products and generating wealth, you're going to expect positive cash flows from operating activities and perhaps continuing negative cash flows in investing as the company grows and grows, purchasing even more assets.
When it reaches a stage of maturity, the company's going to have positive cash flows from operating activities, but perhaps it might tail off its investing if it's run out of investment opportunities.
And eventually, as the company gets older and begins to wind down, you're going to see positive cash flows from operating activities, but negative cash flows from financing activities as it returns wealth to its investors and pays off its debts.
So that's just a normal life cycle. The relationship between the three sections of any cash flow statement, therefore, can tell you a lot about where the company is in its life cycle.
Cash from Operating Activities
Let's look at the operating cash flows of Apple to see how they are organized on the statement. This is the most complicated part of the cash flow statement, and in some ways the most complicated part of the entire set of financial statements. So, it's okay if you're a little confused by this. Let's try and work through this, though, and get a sense of what's happening here.
You can look at the bank account to see quite easily how much net cash was generated or used by the company over the course of the year. If you deduct the investing activities and the financing activities, the remainder of the change in cash has to due to the operating activities.
So it's not particularly difficult to calculate that amount. The question is, can you explain where the cash from operations came from, and where it went? What part of your operations generated or used the cash? So there's two ways of documenting that.
The way that's not shown in Apple’s cash flow statement is the direct method. The direct method simply tells you, category by category, where the cash came from or went in each of the different aspects of the operations of the company. How much was paid to employees? How much was paid to suppliers? How much was received from customers? We'll look at examples of the direct method later in the course.
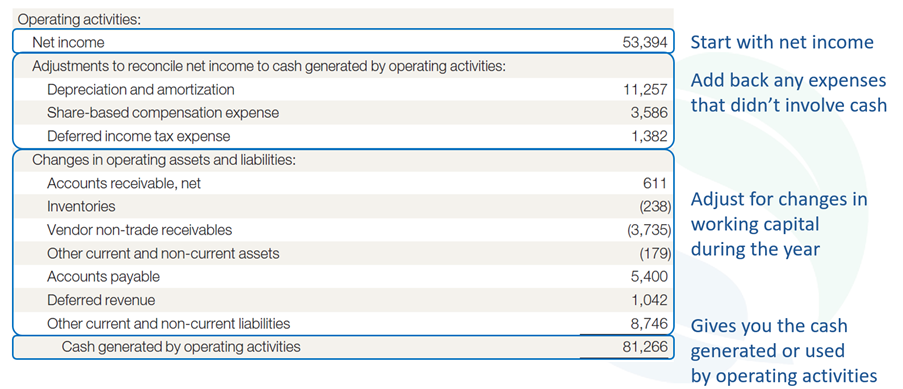
Apple, however, chooses the more common way of doing the cash flow statement, the indirect method. Why is it more common? I'd say it's just convention. This is the way that companies have been doing it for years. The indirect method reconciles the income statement to the cash flows that are generated by the operations of the company. It starts with the net income figure from the income statement. That figure for 2015 was over $50 billion: $53,394 million, to be exact.
The indirect method then involves a series of adjustments to gradually eliminate anything on the income statement that was not a cash transaction. Stop and think about that for a second. The net income is the economic value generated by the operations of the company. That's not the same thing as the cash that exchanged hands during that year.
If you look back at the income statement, you'll see that there were several expenses deducted from the revenues, to end up at net income, that had nothing to do with cash changing hands. Therefore, to reconcile the net income to the cash from operations, you need to add back to net income those expenses that didn’t involve cash. And example of this would be depreciation and amortization. Those are not cash expenses, they are merely an allocation to this fiscal year of the cost of the fixed assets of the company. Those fixed assets would've been paid for years ago when Apple bought the factory or the photocopier or the truck that they used this year to generate a profit. Cash is spent when those assets are acquired, but in accrual accounting, the expense gets spread out over the years that the company uses the assets. It’s a way of recognizing that generating a profit from operations requires a significant investment up front to obtain the necessary assets.
So, a depreciation or amortization expense is deducted from net income, but it’s not a cash expense. If you want to move from net income towards cash from operations, you need to add back to net income all the non-cash expenses that were deducted from revenue on the income statement. In this case, over $11 billion worth of investment was allocated to the 2015 income statement, so that amount, $11,247 million, will be added back in the cash from operations section of the cash flow statement.
Similarly, the share-based compensation expense of over $3 billion was a non-cash expense. We'll get into equity compensation for the CEO, the CFO, and other senior employees during this course. It's a topic that interests a lot of business students because, well, one day you'd like to be paid that way as well. It's pretty complicated, though, so we’ll set it aside for now. The important thing here is to realize that it was a non-cash expense, because the executives were given share options worth $3,586 million, not $3,586 million in cash. So that figure needs to be added back to net income here.
Same thing with the $1 billion deferred income tax expense. It’s a complicated topic that we can come back to later, but for now, we can understand that it didn’t involve an expenditure of cash, so $1,382 million gets added back here.
So, to recap, all three of those numbers were expenses deducted on the income statement, but they actually didn't involve cash expenditure. So, they are added back when using the indirect method for the cash from operations section of the cash flow statement.
Now, if you take the $53 billion net income figure and you add the $11, $3 and $1 billion figures, you're going to be up to almost $70 billion worth of cash. We are part way towards explaining the total cash generated by Apple’s operating activities.
The next step under the indirect method is to take into account any changes on the balance sheet that were related to operations. This means the current assets (excluding the cash, which is what we’re trying to explain here) and the current liabilities. These are considered “working capital,” meaning they are part of day-to-day operating activities, as opposed to investing or financing activities. Let me give you an example of how changes in working capital affect cash.
If you were to start with $1,000 worth of inventory at the beginning of the year, and at the end of the year you had $2,000 worth of inventory, that would indicate that regardless of what happened during the year in terms of selling product to customers, you spent an additional $1,000 on your operations in order to obtain more inventory. An increase in inventory implies a use of cash.
By the same token, if you had $1,000 worth of inventory to start with, and at the end of the year you had only $500 of inventory left, you would've saved $500 worth of cash by selling that inventory off. That is, the cost of the goods sold to customers, which was deducted on the income statement, would not have been entirely a cash expense. Some of that expense would have been inventory that was actually paid for the previous year, because it was already in inventory at the beginning of the year. Just like we added back non-cash expenses like depreciation, we add back the portion of the cost of goods sold that was inventory paid for the previous year.
So these changes in working capital – changes in the current assets and the current liabilities, which Apple refers to as “operating assets” – must be taken into account when reconciling the net income number to the cash generated by operating activities. Keep in mind that positive numbers here mean an increase in cash from operations, while negative numbers indicate a use of cash.
Students are often confused by this part of the cash flow statement. When you see the words “Accounts receivable,” “Inventory,” and “Accounts payable” on the balance sheet, they are there to list the value of those items at the end of the year. When you see the same words on the cash flow statement, they are there to list the change in cash, positive or negative, that was related to increasing or decreasing those balance sheet items during the year. Same words, different context.
So what do we see when we look at Apple’s 2015 cash from operations? As we said, Apple’s operations generated a ton of money, almost $70 billion, even before you start looking at changes in the current assets and current liabilities. So let’s look at the change in cash related to inventory, as an example of a change in working capital. It shows as a negative number, 238 in parentheses. The negative number tells us that cash was used up, not generated, and the label “Inventories” tells us that the cash was used to acquire more inventory. If you were compare the inventory numbers on the balance sheet for 2014 and 2015, you would see that inventory rose by this same amount, $238 million.
The same thing with receivables. There's an increase in receivables on the balance sheet, meaning that during the year they made sales to customers, business-to-business customers included, and collected $3.7 billion less from the customers than the amount they sold. That implies a use of cash: the revenue figure that went into Apple’s net income number was not all cash sales, so we need to back out the increase in accounts receivable if we are to reconcile net income to cash from operations.
The figure for accounts payable on the cash flow statement is a positive number. So what does this mean? Accounts payable is the money the company owes its suppliers. If that number goes up during the year, that's an increase in liability, but also a savings of cash. More inventory, for example, was acquired and made available for sale than was paid for during the year. There was therefore a net savings of cash. For Apple, in 2015, accounts payable increased by $5.4 billion.
Think of it this way. If you sell an inventory item that has a cost of $1, you have an expense on your income statement of $1. There are two ways in which that $1 could be a non-cash expense. One is if the inventory item had been paid for the year before. We discussed this possibility above when we talked about the change in inventory. The other possibility is that the inventory was acquired during the year without paying for it yet. If that happened, the accounts payable would have gone up by $1. So, just as an decrease in inventory suggests that part of the cost of sales was not a cash expense, so too an increase in accounts payable suggests that part of the cost of sales was not a cash expense.
You're going to have to become comfortable looking at these changes in current assets and thinking them through, because that's somethings that's going to come back to haunt you every time you look at a cash flow statement. (You’ll learn to love companies that use the direct method. It is so much simpler to understand!) Try to understand the cash implication of an increase in inventory (the company must have paid for it) or an decrease in accounts payable (the company must have paid its suppliers). From there, the rest of the changes in non-cash working capital can be worked out.
All told, Apple’s cash from operations, starting with the net income, then adding back the non-cash expenses like depreciation, and then adjusting for any changes in non-cash working capital, comes to $81 billion, a vast amount of wealth by anybody's standards. Let's look now at how that compares to the other sections of the cash flow statement.
Cash from Investing Activities
Here's the investing section of the cash flow statement. Investing activities are when the company buys or sells long term assets.

Now, some of these things are negative numbers, right? So, purchases of marketable securities, that's a negative number. Remember we're on the cash flow statement. So a negative number means a use of cash. This means the company used $166 billion to buy marketable securities. It also made a smaller investment in acquiring other businesses.
So isn't that interesting, right? We're talking about Apple, a company that is constantly on the lookout for startup technology companies that it can acquire and merge into it’s own operations: for example, the Beats company with its headphones. However, the net business acquisitions of Apple were only $343 million during the year. This compares poorly to $166 billion that Apple spent just investing passively in the stock market.
This does not indicate to me a company that's really focused on identifying and acquiring new technology opportunities. Either that or they are focused on that, but they were simply not able to find much, which is a different problem that could also be behind the numbers we're seeing here. So, Apple has no problem finding stocks and bonds to buy, but it's got a bit of a problem finding new businesses to buy.
Apple did however, invest over $11 billion in property, plant and equipment. This would be opening new factories, new stores, and so forth. Apple also acquired some intangible assets. So for instance, if you are Apple and you bought Beats from Dr. Dre, then you are going to pay a certain amount of money just for the rights to use the brand name. So that's what an intangible asset would be when you acquire it.
“Other” we will ignore. It’s a very small number.
The point here is that these negative numbers signify that Apple is using cash to buy assets. What about the positive numbers? Let's look at them.

Here we have proceeds from the maturities of marketable securities and proceeds from sales of marketable securities. These lines include any bonds Apple had previously invested in that matured this year, plus all the other stocks and bonds that it sold during the year.
The difference between maturities and sales? When you buy a bond, it's got a fixed term on it: for example, a six-month bond or a three-year bond. During the term of the bond, the company that issued it pays you interest. When the fixed term expires, you hand the bond back to the company that issued it and you get your money back. You don't have any choice about that, it just happens because the bond matured. That’s the first line. The second line is all of the other proceeds come the sale of marketable securities. This includes the decision to sell a bond before it's maturity date, and the decision to sell any stock in another company (stocks do not have maturity dates). All of that selling would generate cash that gets included on the “Proceeds from sales of marketable securities” line.
Thus the only positive numbers here, the only lines in the investing section of Apple’s cash flow statement that indicate an increase in cash, have to do with marketable securities. We can see, then, that Apple bought marketable securities for $166 billion, and sold about $121 billion worth of marketable securities, for a net investment of about $45 billion. That’s a net cash outflow.
The overall amount that Apple invested during the year was $56,274 million. We’ve learned that most of that went into the stock market. Only about 20% of that went into acquiring useful assets like other businesses, property, plant and equipment, or intangibles.
Cash from Financing Activities
The final section of the cash flow statement is the financing cash flows. This pertains to all of the relationships that a company has with its investors and with its creditors. For Apple, what was the net effect on cash of its transactions with those other entities?

What have we got here? Some of the figures are quite small, especially the first two, which are related to Apple issuing some shares to its executives. (You can read more about executive compensation here.) Those small cash flows into the company from the executives and from tax benefits, are offset by tax paid by the company in order to provide those shares to its executives at a discounted price. So, the net effect on cash is slightly negative there.
The company also paid $11 billion worth of dividends to its shareholders, and spent $35 billion repurchasing its own shares on the stock market. So although it issued a few new shares to its executives, most of the activity in the stock market for Apple was actually to buy back a much larger number of its shares.
So this is kind of curious, right? You think of companies issuing shares in order to raise money, but here you've got a company like Apple, which has tons of money lying around. It doesn’t need to issue any more shares to raise cash. What it can do with its cash is use it to buy back shares on the stock market. And this was a very contentious move by Apple at the time. You can read more about it here. You can also, of course, look up news articles on the topic yourself.
In some ways, repurchasing shares is an alternative to paying dividends. The difference is that when you pay dividends, all of the shareholders will get those dividends, regardless of whether they wanted the money or not.
Why might you not want the money, if you were a shareholder? Well, you might believe that Apple should hang onto its cash and invest in new products. So if you're in that category, you don't want dividends. But if you're a shareholder who believes that Apple's got too much money and should be giving some of it to you, you’d welcome the dividends.
The thing is, when dividends get paid, they go out to all shareholders regardless of their opinion. Share repurchases, on the other hand, are a way of distributing money to shareholders that gives them the option of taking it. By going to the stock market and saying, "We're going to buy back $35 billion worth of shares," Apple allows anybody who wants to sell their shares to trade them in for cash, while those people who would rather hang onto their Apple shares can do so.
So in some ways this is a quite democratic way of returning money. People can decide whether to take the money or not. They may prefer to let other shareholders take the money and run, leaving them with more valuable shares. (Why? Because by hanging onto their shares while others traded them in, they now own a slightly larger percentage of the outstanding shares.)
What's contentious about this is that it reduces the outside ownership of the company and increases the percentage of the company that's owned by the executives and by the senior members of the board of directors. If you were to do some investigating, you'd find out that the two biggest individual shareholders of Apple are the CEO and the Chair of the Board of Directors. Having Apple repurchase its shares serves their interests because it gives them a higher stake in the company, and thus even more control, along with less scrutiny from outside shareholders.
So this is why it's contentious for Apple or any wealthy company to be repurchasing it shares. There's some good things about it, in that it allows investors to choose whether to take the money or not, but there are also questions to be asked about whether it's a conflict of interest for the CEO and Chair to be voting for this at the board meeting.
The last section of the financing cash flows section has to do with Apple borrowing money. You can see there were $27 billion worth of proceeds from long-term debt. We saw that increase in debt earlier when we were looking at the liabilities section of the balance sheet. There was also cash coming in from Apple issuing some “commercial paper.” Commercial paper is just another debt instrument. If you are interested in learning more, you can read up about it on Wikipedia.
These cash flows from taking on debt together amount to almost $30 billion in cash. Why did it borrow so much money when it already had a lot of money sitting around in cash and in marketable securities? Well, quite clearly, it did so in order to help pay the dividends and repurchase its common stock.

Now that's a real conundrum. Why not just use the cash it already had? If you want to find out more about this, check out my article on the topic on this website. I delve into Apple's situation in some considerable detail. The short answer is tax.
Conclusions
Let's see if we're ready to draw some conclusions about Apple.
We've finished looking at the financial statements for 2015 for Apple, and we've been doing that in order to try to get some clues about this question we started with, which is why did Apple sales drop in 2016?
So what have we learned? We've learned that Apple is overreliant on its cell phone sales. In many ways, it is a cell phone company now. The iPhone provided most of the sales, and most of the sales growth, during 2015. It's a hugely profitable product, but this leaves the company exposed to competition. And looking back now on what happened in 2016, we know that the company began to run into competition from Android and Huawei phones.
We also saw that in 2015, the company had excessive amounts of what I've called unproductive assets: cash that's not invested anywhere and marketable securities, which represent Apple simply investing in this stock market because it doesn't have any products or factories of its own to invest in to generate even more wealth for itself.
Compounding the problem is that the operations they do have generate vast amounts of cash, but rather than being a source of joy for the company, they end up with even more cash that then has to be parked in the stock market in order to earn at least a little return, as negligible as it was during that period of time.
Apple has no new ideas to invest in because despite all of its expenditures on R&D, which we saw on the income statement, it has come up with no new products of any consequence to invest in since 2010, when it introduced the iPad. Prior to that, in 2007, was the iPhone, and the iMac was even earlier.
The only new products that Apple has introduced have either been bought from somebody else, like the Beats headphones, or have been these great brainwave ideas announced to great fanfare, like the Apple Watch, which ended up doing little for its bottom line.
So the company has struggled for many years to come up with a new home run product to replace, or add to, the iPhone and the iPad.
Lastly, we saw in the 2015 financial statements some clear indications that the company was unwilling to use its own cash to pay dividends to its investors. Both the dividends and the share repurchases were financed largely by borrowing money rather than using the cash that it had on hand. That is a bit of a side problem, perhaps unrelated to the sales drop, but perhaps not. Maybe Apple’s twin obsessions with tax avoidance and repurchasing shares became a bit of a distraction for the company's leadership. Maybe they took their eye off of the ball. This is just a hypothesis, of course, but all of these things together suggests that the company is not as focused on new products and new product development as it might be, despite its vast expenditures on R&D compared to many other companies.
So let's just check the insights that we’ve just listed. One of the things you want to do after this kind of critical thinking is to recognize that financial statement analysis is really just the beginning of your inquiry. We have developed some tentative hypotheses about Apple's tax situation and about product development, about the competition that it's receiving from Android phones and from Huawei – not to mention competition from Samsung, which is a curious case because Samsung is actually the largest supplier of parts to Apple. It makes the chips that go into the iPhone.
So all of this activity is going on around Apple. It is worth paying attention to. You can't come to firm conclusions just by looking at the financial statements, even though the financial statements can give you all kinds of clues as to where to look next.
So if we were to look outside the financial statements for other evidence, what are some things that we already know? The most obvious thing to consider might be the death of Steve Jobs in 2011. That might be what's behind the loss of creative drive at Apple and the lack of new products to bring to market.
You could also do a market analysis of the cellphone industry and try to quantify just how much competition Apple is getting from Android phones and from Huawei. Obviously, the rise of Huawei as a global competitor is affecting Apple in the one area where it mattered the most, which is the cellphone market in China. That was the fastest growing market for its most profitable product, but then Huawei came along and began to dominate that market. That was a significant setback for Apple, no matter how you look at it.
And then you could look deeper into Apple’s tax issues, which I suggested might be a distraction for Apple's leadership. If you were to look at the news in August 2016, you’d see there was a surprise tax bill for Apple from the European Union, claiming back taxes that Apple had unfairly avoided.
All of these things may be taking Apple away from its focus on product development and sales. However, you also need to look for contradictory evidence. You can't just look for evidence that backs up the insights and hypotheses that you've developed from your initial analysis.
I would suggest that you give some thought to this yourself. Where would you begin to look for contradictory evidence? Where would you begin to look for evidence from 2015 that Apple was actually succeeding and that this drop in sales the next year was just a blip? How would you go about building an alternative interpretation of the 2015 financial statements? I've taken my interpretation in one particular direction, in order to highlight some of the issues lurking behind the financial statements. But Apple is a very complicated company and there was all kinds of good news that year as well.
You could build a fairly persuasive argument in the other direction if you were able to back it up with other evidence from the financial statements, and with new information from outside the financial statements. And it's obvious that people do come up with different interpretations because, on any given day, some people buy Apple shares and other people sell them, reflecting different beliefs about where the company is going.
All of this is to say that reading financial statements is an intriguing way to start understanding what's going on at a company. To look at the economic evidence that the company itself provides, to begin to think critically about it and try to call into question the interpretation that the company is leading you to take from that information, is to open up deeper understanding of financial accounting.
You are in charge of creating meaning from financial statements for yourself. You can't simply be a passive reader of the financial statements and accept the interpretation that the senior managers of the company would like you to take from it.
Summary
Let's summarize what we've learned.
We've taken a good look at the three main financial statements — the income statement, balance sheet, and cash flow statement — using Apple’s 2015 year-end as an example. We have learned, I hope, how to read these statements at a basic level and to see how they're connected to each other. Plus, we’ve developed some critical questions about what we’ve seen.
The most important thing for me is that this lesson has, I hope, helped you begin to think critically about financial statements and not be a passive reader. There is much more to come in the rest of this course. I hope you enjoyed this first lesson. When you are ready, on to the next!
Title photo: downtown Toronto, home of Canada’s finance industry, taken from Humber Bay