
In this lesson, we cover the very important topic of inventory. This includes all the items that a company has bought or built that it has for sale. It’s not as simple as it sounds, because of the matching principle: if you want to do a good job of matching the cost of sales to the same period as the one where sales are recognized, you need to think beyond the cost of basic materials.
We're going to look at some basic definitions about inventory, and then we're going to consider:
how inventory is measured on the balance sheet;
cost flows, which is how inventory flows through the company;
inventory control; and
an interesting example of how to manipulate earnings using inventory.
What Counts as Inventory?
Inventory is defined in IFRS under IAS 2. The three categories that it covers are:
Assets held for sale in the ordinary course of business. This would be finished inventory items, the intuitive notion of inventory. It does not include assets held for sale that are not in the ordinary course of business. For instance, if a company has decided to sell a factory or one of its delivery trucks, these are not goods that the company sells in the normal course of business, so although they're held for sale, they're not considered inventory.
Assets in the process of production. These are partially assembled inventory items, and they also count as inventory.
Consumable materials and supplies. These are the raw materials that go into making products, the screws and glue and so forth that are used to assemble the company’s products. That's considered inventory, and it is the most common type of inventory for service companies that don’t sell products. The consumable materials in the store room — pens and paper and printer cartridges — those can be considered inventory, too.
Things That Are Not Inventory
What's not covered in IAS 2 are things that are similar to inventory in some ways, but are covered elsewhere in IFRS. For instance, work in progress is covered under IFRS 15, Revenue from Contracts with Customers. If you're a construction company, the building that you are erecting is likely going to be billed out to the client gradually, perhaps on a floor-by-floor basis as you make progress. This is indeed a partially assembled item that you intend to sell to a customer, but it is not considered inventory under IAS 2. It's treated as part of a contract with the customer.
The same goes for consulting firms that may have outlays — wages, employee expenses, and so forth — as they work on a consulting gig. If they are not ready to bill the customer yet, the costs associated with the revenue get capitalized as assets that will eventually be expensed when the revenue is recognized. They are not strictly speaking inventory, though, as far as IAS 2 is concerned. They are also covered under IFRS 15.
Financial instruments that are held for sale are covered under IAS 39. There are technicalities around financial instruments that have nothing to do with the way that inventory is costed and measured, so they have their own accounting standard.
Agricultural and forest products are covered under IAS 41. One of the key distinctions here is the whole notion of a plant, which is a bit problematic to an accountant. If you've got an apple orchard, what does your inventory consist of? It does not consist of your apple trees, because those are plants that you are going to hold onto through to the next growing season. It’s not even the apples that you’ve picked! Why? Because agriculture products are often sold under forward contracts, so they don’t belong to you in the same way that a hardware store’s inventory belongs to it.
The same thing goes for commodities. Commodities held for sale — oil, gasoline, gold, and so forth — those sorts of things might seem like inventory, they're not covered under IAS 2 because they always have to be measured at net realizable value, not at the cost of obtaining them. The fact that commodity markets can go up and down at any time makes the value of these assets volatile, and since the market price is easy to look up on the spot market, it’s used to value them. IAS 2 deals with issues that simply don’t apply here.
Measuring the Value of Inventory
Now that we know what counts as inventory, the next question is how do you measure its value?
Lower of Cost or NRV
Inventory is measured at the either its cost or its net realizable value, whichever is lower.
Cost is not as simple as it might sound. Under IFRS, there are a whole bunch of costs related to inventory that you should include in the value of your inventory besides the price you paid for raw materials, parts, or finished items.
In addition, there’s the tiny problem of something potentially happening to your inventory after you’ve paid for it — water damage, fire, theft — that negatively impacts the value of your inventory. If the loss of value is so great that the inventory is now worth less than what you paid for it, it would be misleading to list the inventory at cost. You should list it at whatever you can reasonably get for it. This is what’s called net realizable value.
Note that it is unlikely in most businesses that all the company’s inventory will be damaged or stolen at once, so some inventory items will be valued at cost and others will be valued at net realizable value. The total value of all the inventory items for sale will be what’s shown on the balance sheet.
Let me give you a concrete example. Suppose that it costs you $1,000 per item to acquire your inventory and get it ready for sale. Perhaps, for instance, some of the cost was for purchasing the parts and some was the labour for assembling the parts into finished items. You are planning to sell the units for $1,200 each. Your inventory should be valued at $1,000 per item, since that is your cost. You don’t list inventory at the price you expect to get for it.
But now you find out that the market has dropped and the units can only be sold for $800. You can no longer show the inventory at $1,000 apiece. That would be misleading. It would violate the accounting principle of conservatism. You have to show the inventory on your balance sheet at $800 apiece because that's all you're going to get for them. That's your net realizable value.
So you can see, it doesn’t have to be physical damage to the inventory that reduces its value. It could just be the machinations of the market.
Also, if there are disposal costs involved with getting rid of your inventory, then that should be deducted from the net realizable value, as well. For instance, if you can only get rid of the inventory by paying an excise tax or a dumping fee, that cost has to be deducted from the inventory value on your balance sheet.
The other possibility, of course, is that after you've built your inventory and got it ready for sale, something might have happened such as a fire or a flood to damage it, and you know that you can't sell them for the regular price. So that would also lower the net realizable value of the inventory.
So to be conservative, you have to show your inventory on the balance sheet at the lower of its cost to you or the net realizable value.
Cost
So what's included in the cost? Under IFRS, inventory cost is broken down into three categories: the cost of purchase, the cost of conversion, and a general category of other costs.
Cost of Purchase
The cost of purchasing the inventory includes, of course, the actual purchase price that you paid for it. It also includes any duties or taxes that you had to pay, as long as you are not going to be reimbursed for them. Sometimes, for instance, when you import certain kinds of inventory, your government might reimburse you for the duty you paid or give you other incentives because it's trying to stimulate the economy and it wants those kinds of things brought into the country.
Other direct acquisition costs, such as shipping and handling, should also be included in the cost of purchasing your inventory. However, you must deduct from the cost of your inventory any discounts or rebates that you are going to be getting back from the vendor. If you bought a large quantity, for example, you may have earned a discount or a rebate from the vendor. That reduces the cost of your inventory and this should be reflected on the balance sheet.
Basically, then, any cost that is recoverable should not be included in the inventory price. Such a cost could still be shown as an asset on your balance sheet until you collect the reimbursement, because it represents a right to be reimbursed, but it wouldn't be included in the value of your inventory.
Cost of Conversion
The cost of conversion is basically work in process on items that will become inventory for sale. So, if you are a manufacturer, then you are going to be taking components and raw materials and assembling them into units that will be available for sale.
There are three subcategories for cost of conversion:
Direct labor is the wages and benefits that you pay your workers to produce the inventory.
Variable production overhead includes the indirect materials such as fasteners and glue that cannot be tracked to a specific portion of inventory (e.g., a specific item or lot). It also includes the indirect labor of workers who help produce your inventory but whose time cannot be tracked to a specific portion of inventory.
Fixed production overhead includes costs that do not go up and down as production increases or decreases, but which are fully related to your inventory. Examples would include the depreciation and maintenance of your production assets (factory, machines, and so forth), as well as the salaries of people who manage and administer your factory.
All of these costs should be allocated to inventory on some sort of systematic basis, not as the whim takes you. In this way, the costs will be recognized as expenses when the inventory is sold, rather than in the period in which you paid the costs. This is the matching principle in action.
Other Costs
Other costs included in the value of inventory are those necessary to get the inventory into saleable condition and to the location where it can be purchased by the customer. Think of a car dealership. Moving the car that a customer is considering from your storage facility to the showroom, peeling off all the protective plastic coatings, and getting it ready for the customer to come in and kick the tires — that’s all the cost of inventory.
Excluded Costs
Some specific costs should be excluded, though:
Wastage is excluded. If you built some inventory items and they didn't pass quality control and you had to throw them out, the cost of those items does not get included in inventory. It is expensed right away as wastage.
Storage of finished goods is excluded. Once the inventory is ready for sale, the cost of warehousing it in the area where you're going to be selling it is not considered part of the inventory cost. This is different from the storage of raw materials and parts that have not yet been converted into inventory.
Administrative costs that are unrelated to inventory are excluded. Head office salaries, for example, are not included in the cost of inventory because those managers are not directly involved in producing inventory.
Selling costs are also excluded. Marketing costs, advertising, the cost of your website where customers place their orders, any social media work that you pay people to do, sales commissions, and so forth — those are the costs of convincing customers to buy your inventory from you, not the cost of inventory. Even the cost of shipping goods to the customer is not an inventory cost, because it is incurred after the inventory is ready for sale. None of these costs are included in the cost of inventory on the balance sheet.
You can see that under IFRS, the cost of inventory is pretty detailed. It’s more than just the wholesale price of that hammer in the hardware store.
Just to wrap up this notion of cost, let’s be specific about an expense category that you often see on a company’s income statement: “selling, general, and administrative costs,” or SG&A. These are the regular, general costs of running a business. They are unrelated to inventory and so they are not included in the cost of inventory on the balance sheet. I’m only mentioning this because the term includes the word “selling” and I want to be completely clear. SG&A covers the following kinds of non-inventory expenses:
Selling costs: described in detail above.
Administrative costs: this includes the salaries and benefits of managers and admin staff who are not connected to inventory production.
General costs: this would be everything else, such as rent and utilities for your head office, postage, office supplies, computers, and so forth — anything not related to the actual production of inventory.
SG&A therefore includes all these costs that are unrelated to inventory. They are expensed in the period in which they are incurred, not at the time any specific revenue is recognized.
Now, back to inventory!
Inventory Cost Flows
Inventory cost flows have to do with how a company tracks the cost of inventory from the time the cost it is added to inventory to the time it is recognized as an expense in cost of goods sold. Note that we are talking about the flow of costs. This may be different from the flow of physical inventory items.
If this doesn’t make sense to you, think about how other assets are metered out to the income statement through depreciation and amortization. Sometimes it’s easier just to make an assumption about the flow of expenses to the income statement rather than trying to track the costs perfectly. An inventory cost flow is an assumption for accounting purposes, and though it may well be connected to physical inventory movements, it can be different. The point is to have a consistent way of accounting for inventory so that managers can’t rig their financial results.
IAS 2 specifies three different ways of accounting for inventory costs flows.
Specific Identification
The first is specific identification, so anything that's got a barcode on it. If you're a store that sells television sets, the goods you order from the manufacturer would consist of items with unique barcodes on them. You would be able to track exactly which item came into inventory and what it cost you, and then when you sell it, you'd be able to identify exactly which unit sold and what cost should be matched to the revenue. There would be no argument about what the cost of goods sold is.
However, when you don't have the ability to specifically identify your inventory items, you have to make some assumptions about it. There are two permissible assumptions in IFRS, and I’ll explain them next.
FIFO
The first assumption is referred to as FIFO, which stands for “first in, first out.” This is the assumption that when you sell a unit, it was the oldest one you had in inventory. That may or may not be exactly what happened physically, but it is certainly a reasonable assumption for lots of businesses. When inventory comes in, you sell the older stuff first and sell the newer stuff last.
If you make this assumption, then you're going to be able to figure out the cost associated with any units that you sell. They should be assigned the costs pertaining to the oldest purchases in your purchase history. What's left over in inventory at the end of the year, then, is assumed to be the stuff that was bought under the latest prices that you paid your inventory suppliers.
If a company makes this cost flow assumption, it doesn’t matter if they sometimes sell a newer inventory item instead of an old one, because there will be no incentive for the company to do this in an attempt to influence its profits. You can imagine how this incentive might arise: if you get a discount from the supplier and then purposely sell those physical items, you could inflate your earnings. By making a consistent cost flow assumption, this temptation is no longer there.
Now obviously, this cost flow assumption only makes a material difference if the cost of inventory rises or falls quite a bit. If inventory costs are stable, the assumption is not going to make any difference. We'll see some examples of this in a moment.
Weighted Average Cost
Weighted average cost is a method of (figuratively) lumping all your similar inventory items into one big pile and not caring which units you sell. Physically this makes sense if you're selling a bunch of nails. You buy some new nails, you dump them in the bin. A customer comes along, grabs a bag of nails, and you don't care which nails they took.
Note that if you decide to account for your inventory like this, it doesn't have to be stuff that physically behaves in this way. You can simply make an assumption that it does and stick with it.
The way average cost works it that you add up the total cost of your inventory, everything that was there at the beginning of the period, plus all the purchases, and then divide by the total number of units. The “weighted” part of “weighted average cost” comes from the fact that the quantity purchased at a given cost is factored into the equation: 10 units at $1.00 plus 2 units at $1.50 is a lower total cost than 6 units at $1.00 plus 6 units at $1.50, even though the total number of units is the same. The cost calculation is weighted by the number of units purchased.
The total amount spent on inventory divided by the total number of units gives you the cost of the average inventory item. As long as you also track the number of units sold, you can easily calculate both the cost of goods sold and the cost of the units left in inventory at the end of the fiscal period.
Now, you can calculate average cost in two different ways. The simplest is to wait and calculate it at the end of the fiscal period when you do an inventory count. The other would be to update the average cost every time you receive a shipment of goods, and also keep track of the units sold on a daily basis. This second method leads to a different cost of goods sold for items sold before and after a shipment, assuming that the per-unit cost of the items in the shipment differs from the items you already had in inventory. This second method is referred to as “moving average cost,” and it’s definitely more complicated. Either way, though, the average cost method gives you the values you need without too much work.
Choosing a Cost Method
IAS 2 requires you to use specific identification when you can. The other two methods are for measuring the cost of inventory items that are not uniquely identifiable, and are both assumptions about how the inventory costs flow. You are free to pick either of them for any type of inventory where the items are identical.
LIFO
Just a note about LIFO, which stands for last-in, first out. This is a costing method allowed under GAAP, the accounting regulations that pertain in the USA. In a nutshell, it’s FIFO, but backwards. IFRS does not permit LIFO to be used, presumably because companies using LIFO can fairly easily manipulate their cost of goods sold, and therefore their profits, simply by not re-ordering stock.* Allowing inventory levels to drop would trigger the sale of old inventory, which, if costs have been rising over time as they usually do, would have been purchased at a lower cost. Selling those old units, instead of newer, more costly units, would generate higher profits that are purely driven by the company’s accounting choices, not its financial performance. International accounting regulators love to think that accounting measures something real.
* Stock in this case refers to inventory units, not shares in a company. Lots of words in accounting have multiple meanings, and in my experience, it can confuse the hell out of students.

Weighted Average Cost vs FIFO
Here's an example of weighted average cost versus FIFO. These are the two methods that you would use when you are simply making assumptions about how goods are flowing through the company.
Here we made four different purchases. For simplicity’s sake, I’ve assumed that we had no inventory when we started, and each purchase is the same quantity, 1000 units. The bars in the graph therefore indicate the unit cost at time you made those purchases, not the number of units, just to help you visualize rising costs.
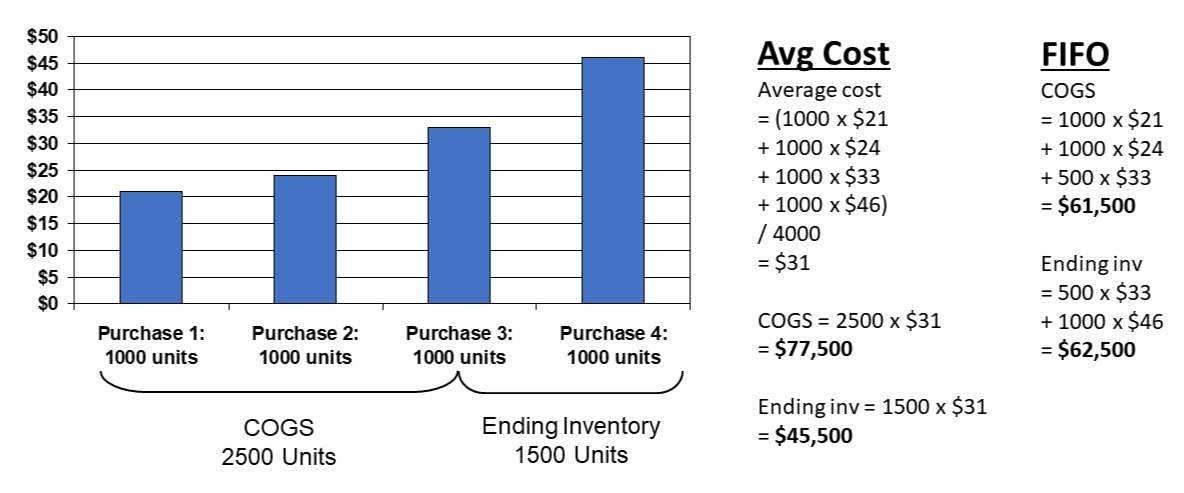
The first time we purchased units was at $21 apiece. The second purchase was at $24, the third at $33, and the fourth at $46 apiece. So costs are rising. What is the impact of using weighted average cost versus FIFO?
Weighted Average
Let's calculate average cost first. Here we are using the simple version of the calculation, not the “moving average” version, so we don’t care what day we sold the inventory to customers. We just know that the sales took place sometime during the period we’re looking at.
Average cost is going to be calculated by first adding up the total cost: so, 1000 x $21 + 1000 x $24 + 1000 x $33 + 1000 x $46, divided by the total number of units, which is 4000. This gives you an average cost of $31 per unit.
We’ve kept track of our sales, so we know we sold 2500 units during the period in question. This gives us a cost of goods sold of 2500 x $31, which is $77,500. Our ending inventory value is 1500 x $31, would be valued at $45,500.
FIFO
Now, if we wanted to do this on a first in, first out basis, the calculation is going to be a little bit different. Let's look at that.
So the assumption with FIFO is that the 2500 units that we sold came from the first couple of purchases, plus part of the third purchase. What's left over in inventory is assumed to be 500 units from purchase #3, and all of purchase #4.
Now, as I said, this doesn't have to be what happened physically. We are just assuming that this is what happened so that we can have consistent inventory costing without having to train our sales staff to always get the oldest unit of inventory when making a sale. That might be worth doing if we are selling bread, which goes stale, but for identical shirts or hammers, it’s doesn’t make any difference.
What does the calculation look like under FIFO? Well, the cost of goods sold is going to be 1000 X $21 (that's all of the first purchase) + 1000 x $24 (that's all of the second purchase) + 500 x $33 (that's half of the third purchase), which gives us a cost of goods sold of $61,500. Our ending inventory value is going to be the remaining half of purchase three and all of purchase four, which is a value of $62,500.
Comparing the Results
In this example, we spent $124,000 purchasing our inventory. The weighted average method divided up this overall cost into a cost of goods sold of $77,500 and an ending inventory of $45,500. The FIFO method divided up the overall cost into a cost of goods sold of $61,500 and an ending inventory of $62,500.
You can see that the choice of methods does make a difference in this case, because costs are rising very dramatically during this accounting period. FIFO “sold” the cheaper units first, so cost of goods sold is lower and our profit is higher. Our current assets and total assets are also higher because the more costly units are still assumed to be in inventory. All of these make the company look better to a financial analyst. If the costs were more stable then the difference between the methods wouldn't be so dramatic.
Inventory Control
Inventory control is about ensuring that everything you purchased is either still in the warehouse and it's been sold to customers. It hasn’t grown legs and gone somewhere else. There are two common ways of using accounting to keep track of inventory.

Periodic
The periodic system is used when you don't have sophisticated computer systems. A small store might adopt this approach. Of course, point-of-sale systems are becoming extraordinarily cheap, so anybody with an iPad can have a point-of-sale system running at their sales counter. But, for the sake of humoring accounting textbook authors everywhere, let's talk about periodic inventory control.
With a periodic system, you know the value of your opening inventory from your balance sheet, because you did an inventory count at the year-end and calculated its cost. You then keep track of all your purchases during the year, so you know how much you spent. The total of those two amounts gives you the cost of goods available for sale during the year.
The final thing you do is count your inventory again at the end of this fiscal year to determine how much inventory is left, and calculate the value of that inventory. The difference between the cost of goods available for sale and the value of your ending inventory will be your cost of goods sold.
Perpetual
Under the perpetual system, the first three steps are the same. You've got your opening inventory and you've got all your purchases, so you know the cost of goods available for sale. However, you then deduct from that total the cost of goods sold at the point of sale, which is where your point-of-sale system comes in. As you go about selling stuff, you record both the sale and the cost of goods sold at the moment of sale.
With this information in hand, at the end of the fiscal period you will know what your expected ending inventory should be. When you then do your inventory count, you can see the difference between what you expected to have on hand and what you actually counted. That difference is called shrinkage, or sometimes leakage. Shrinkage can happen because stuff went wandering out the warehouse or in one way or another. There could have been theft by employees, customers, the store manager, or anybody, really. Or, it could simply have been a mishandling of inventory purchases, for instance, a shortage from the supplier that no one noticed at the time.
Using a perpetual system is the only way that you can actually know the shrinkage amount. A periodic system can't tell you. Perpetual inventory systems are therefore very useful for inventory control, although they are a bit more work and require a point-of-sale system.
Implications
I find it interesting how textbook authors, when they write about inventory control, often reveal their own assumptions about the purpose of a company and its relationship with its employees. I’ve provided some alternatives to the assumption that shrinkage is caused by employees stealing from their employer. That explanation is not only a bit lazy, it’s harmful because it reinforces hegemonic beliefs about the role of capital. It presumes an adversarial relationship between the company and its employees, which is not always present, and suggests that it’s the employees who are taking advantage of the employer. Perhaps this is worth thinking about a little more deeply. I’ll leave it there for now, though.
Here are two key points in time that I want to highlight in these systems. In the periodic system, the key point is when you do your ending inventory. In the perpetual system, the key point is right at the moment of sale, when your point-of-sale system records the inventory going out the door. When you learn about the quantity of inventory is the main difference between the two systems, and that is what makes a perpetual system worth the investment.
Earnings Manipulation through Inventory

So far in this course, we've talked about earnings management as something accomplished through estimates provided by management to the auditors, which become embedded in financial statement calculations. This includes things like the allowance for doubtful accounts, for accounts receivable, or valuation allowances, for tax assets.
These estimates are, fundamentally, predictions of what will happen in the future. Inventory, however, can be used to manipulate earnings much more directly. Let’s consider the example of a manufacturer of kitchen faucets.
First, imagine a production plan that keeps the manufacturer’s inventory levels steady at 50,000 faucets, while producing and selling 400,000 faucets every year:

Everything is the same from year to year, very regular indeed.
In this example, the price the company is expecting to get per faucet is $100. Based on the units sold, that produces revenue of $40 million (400,000 faucets x $100). The costs associated with this revenue are, first, the number of units sold times the variable cost of $40 per faucet, and second. an allocation of the $8 million in fixed costs.
The variable costs include the direct labor in assembling the faucets, consumables like washers and screws, and the wages of shift supervisors — anything that varies with the amount of production at the factory. The fixed costs have to do with things like the depreciation of the factory and the salary of the factory manager, which do not change when production goes up or down.
If you take the $8 million of fixed costs and divide it by the 400,000 units, you get $20 per unit. Your total cost for each faucet is therefore the $40 variable cost plus the $20 allocation of fixed costs, for total cost per unit of $60. And that, when multiplied by the 400,000 units produced and sold, gives you a cost of goods sold of $24 million. And of course, revenue minus cost of goods sold gives you a gross margin $16 million.
That is going to be the steady state across all of these years. Your opening inventory and closing inventory don’t change, your revenue and expense don’t change — it’s all steady state.
So how can management manipulate the earnings of the company by over-producing?
Let's leave everything the same in regards to the sales and the production costs, and look at what happens simply by management deciding to over-produce — that is, deciding to make more faucets than are needed to meet demand:
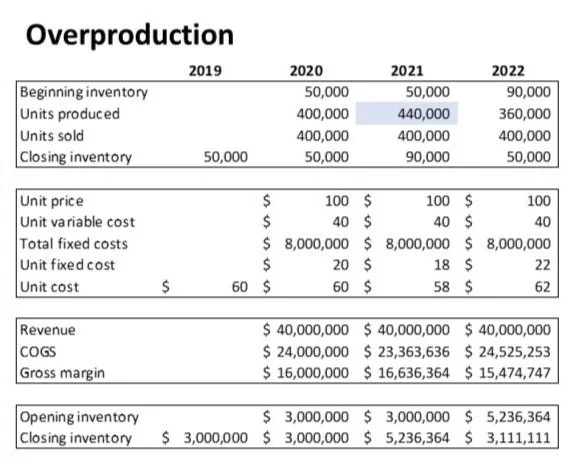
The overproduction is highlighted. It happens in 2021, and the following year production drops so that the total number of units produced remains the same as in the regular production scenario. All that happened was that in 2021, the company’s managers decided to produce 40,000 more units than were needed, and then compensate for that by producing a correspondingly lower amount in 2022. So, instead of producing 400,000 each year for three years, they choose to produce 400,000, then 440,000, and finally 360,000, for the same total of 1,200,000 units over the three years.
What's the effect of this decision?
To begin with, the number of units in inventory at the end of 2021 is going to be a lot higher, because they produced 40,000 more units than customers wanted. The company ends the year with 90,000 units instead of 50,000.
You also have this really curious thing happening with respect to the allocation of fixed costs. It’s the same $8 million in fixed costs, but that is now spread across 440,000 units rather than 400,000. As a result, the fixed cost allocated to each faucet is now only $18 instead of $20, making the unit cost $58 instead of $60.
This sounds small, but this is a company that is selling a lot of faucets. Lowering the cost per unit by $2 makes a big difference. The cost of goods sold calculation here assumes that the company sold the opening inventory of 50,000 units, which had a unit cost of $60, and then sold 350,000 units with a unit cost of $58. This leaves 90,000 units in inventory, which were produced at the cost of $58 each.
Dropping the cost of goods sold for the year increased the gross margin by $636,364, which will get added to net income at the bottom of the income statement. Closing inventory is also higher by quite a bit, even though the unit cost has dropped slightly, because there are far more units than before in inventory.
What does this mean? It means that the company has enjoyed an increase in gross margin, an increase in profit margin, and an increase in the value of its inventory asset. Now, presumably it had to part with some cash in order to pay for the additional production, so there may not be a big change in current assets. To be fair, the quick ratio may be worse because the company has traded cash for inventory. However, there is going to be a nice improvement in profitability ratios, which is the first thing financial analysts look at.
This is a very simple, straightforward way for managers to manipulate their earnings, and it’s all perfectly legal. The only downside to this is that, as you can see from the 2022 column, gross margin will drop the following year to a level lower than the steady state scenario. If the managers were planning on retiring at the end of 2021, they don't care.
So, this is something to keep in mind. There are real ways for managers to manipulate the earnings, without resorting to accounting shenanigans. When you see changes in inventory values, you should ask yourself what's going on.
Summary
Let's summarize what we’ve learned.
We have covered the question of what counts as inventory. It includes everything that's ready to sell, everything that's still in production, and all the consumables.
We talked about inventory measurement. The cost of the inventory is measured as the cost of purchase, plus the cost of conversion, plus any other costs necessary to get the inventory ready for sale. And there were some specific things that were excluded, such as waste, storage of finished goods, administrative costs, and selling costs.
We also talked about the three different cost flow methods — specific identification; first in, first out; and average cost — and the fact that the physical flow of goods does not have to match the assumptions made for costing purposes.
We talked about methods of inventory control, we contrasted periodic and perpetual methods, and finally, I walked you through that last example of earnings manipulation through overproduction.
I hope this gives you some food for thought.
As soon as you are ready, on to the next lesson!
Title photo: inventory of a small shop in Sri Lanka (credit: Danture Wickramasinghe, my co-author, for our study on microfinance)